Every board deck I have seen in the last fifteen years has a slide that looks roughly the same. There is a circle, or sometimes three concentric circles. The biggest one says something like $84 billion. Inside that, a smaller circle says serviceable available market, $12 billion. Inside that, the smallest circle says serviceable obtainable market, $2.4 billion. The slide is meant to communicate that the business is going after a big market and that the founder has thought carefully about market sizing.
The slide does its job in the boardroom. It does almost nothing for the people who have to actually go sell into that market on Monday morning. The number is too abstract to act on, the segmentation is too coarse to prioritize, and the underlying account list, if there even is one, is usually a spreadsheet someone built in Q2 of last year and has not opened since.
When a B2B company stands up an autonomous pipeline system, the first thing that breaks is the gap between that slide and the operational reality. The agents need to know which accounts to go after this week, ranked by fit and signal, with structured data they can query and act on. A static TAM slide cannot tell them. Something else has to. That something else is a TAM Builder agent, and it is usually the first agent in the chain at any company taking the autonomous GTM playbook seriously.
This piece is an honest walk-through of what a TAM Builder agent actually does, why it is different from a market sizing exercise, how it queries the world, and where it sits in the larger pipeline system. The category is new enough that most operators have only heard the term in passing. The architecture is real and worth understanding, especially if you are about to invest in the rest of the agent stack.
See the full agent system run live: the autonomous agents pipeline demo at Tech Week Boston.
TAM as a slide versus TAM as a working dataset
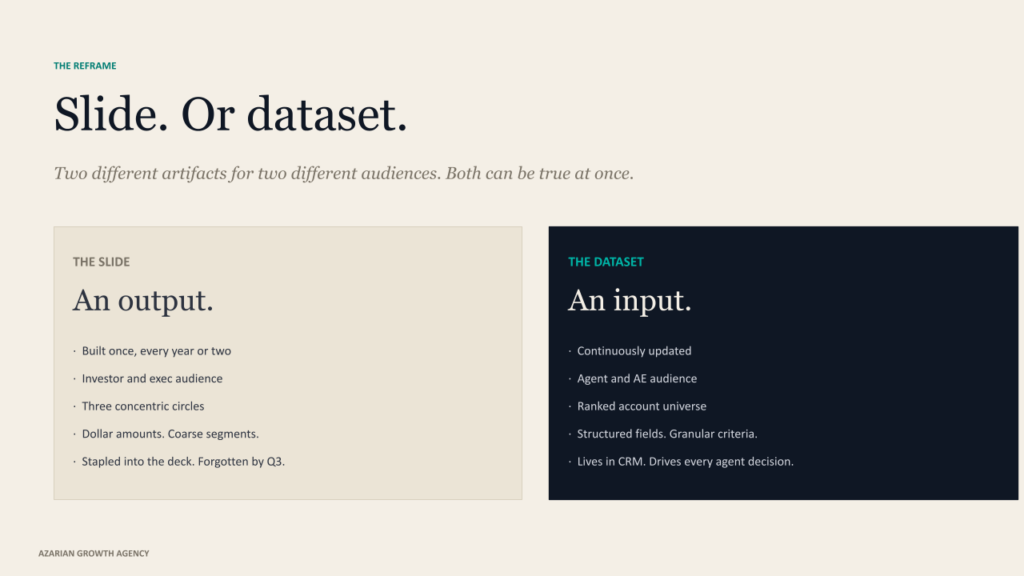
Most teams treat TAM as an output. You do the analysis once, you produce the slide, you put it in the deck, and you move on. The analysis was never meant to drive day-to-day operational decisions. It was meant to justify the size of the opportunity to investors and the executive team.
An autonomous pipeline system flips this on its head. It treats TAM as an input, not an output. It needs the universe of addressable accounts in a structured, queryable, continuously updated form because every downstream agent in the chain pulls from it.
The ICP scoring layer ranks accounts inside that universe. The signal architecture watches for trigger events across that universe. The decision maker finder maps committees inside the accounts that score highest. None of that works if the underlying universe is a static slide.
The shift from slide to dataset is not cosmetic. It changes what you can do operationally. A slide tells you the market is worth eight figures. A working TAM dataset tells you that 3,200 specific accounts match your ICP, that 480 of them have shown intent signals in the last 30 days, that 120 of those just had a leadership change relevant to your buyer, and that twelve of those are inside one degree of your existing customer base. The dataset is what the agent acts on. The slide is what gets stapled into the deck.
When we sit down with a client to stand up an agent infrastructure, the first conversation is almost always about this reframe. Most companies arrive with the slide. We rebuild it as the dataset. The rest of the system depends on getting this right.
The four jobs a TAM Builder agent actually does
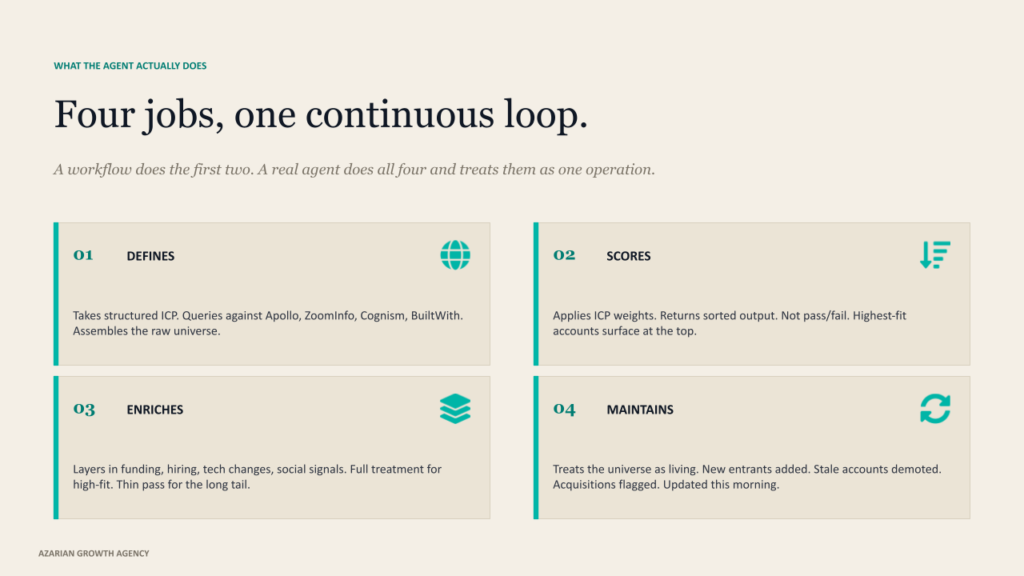
I am going to break this down by job rather than by feature, because the feature lists from vendors tend to obscure what is actually happening. A TAM Builder agent does four distinct things, and a working implementation does all four well or it produces noise.
It defines the universe. The agent takes your structured ICP and translates it into queries against the available data world. Firmographic filters become structured queries against Apollo, ZoomInfo, and Cognism. Technographic criteria are pulled from BuiltWith and similar tech-stack databases. Geographic filters apply across all of them. The agent assembles the raw account universe by running these queries in parallel and deduplicating the results into a single working list. This is the part most teams already know how to do, badly, in a spreadsheet.
It scores the universe. The raw list is not the deliverable. The deliverable is the ranked list. The agent applies the weights from your ICP definition, scores every account against the structured criteria, and produces a sorted output where the highest-fit accounts surface at the top. The scoring is not binary. An account that hits four of five criteria scores meaningfully higher than one that hits two. The weighting reflects which criteria actually predict close-won at your company, derived from your closed-won audit during the ICP build.
It enriches the universe. Once the ranked list exists, the agent layers in the contextual data that turns a row of firmographics into a working account profile. Recent funding events, hiring patterns, technology changes, news mentions, social signals. Clay is the most flexible tool we use for this layer because it can run waterfall enrichment across dozens of providers, but the agent itself decides which enrichment is worth running on which account based on the score. Low-fit accounts get a thin enrichment pass. High-fit accounts get the full treatment.
It maintains the universe. This is the part that static TAM analyses skip. The agent treats the universe as a living artifact. New accounts that emerge in the ICP get added. Accounts that no longer fit get demoted or removed. Companies that get acquired, change category, or pivot are flagged. The dataset that the rest of the agent chain pulls from is not the dataset from six months ago. It is the dataset as of this morning, and the agent does the maintenance work continuously in the background.
Four jobs. The agent does all of them. A workflow that only does the first two produces a list that ages quickly. A workflow that does the first three produces a list that ages slowly but cannot keep up with the market. A real TAM Builder agent does all four and treats them as one continuous operation.
A static TAM is the universe as it was. An agent-built TAM is the universe as it is. The difference is whether the rest of your pipeline system has anything useful to act on.
How the agent actually queries the world
The mechanics here matter because most operators have not seen this work and have a fuzzy picture of what is happening under the hood. The TAM Builder is not magic. It is a structured set of queries running against real data sources, orchestrated by an LLM that decides what to query when.
The orchestration layer is usually Claude Code or a similar agentic runtime, with the agent’s reasoning loop and the prompts that define its behavior living in your repository. Anthropic’s framework for agents is the cleanest articulation of what makes this an agent versus a workflow. The agent decides which queries to run, in what order, against which data source, based on what it is trying to learn about a specific subset of the universe. A workflow runs the same queries every time. The agent adjusts.
The data layer is the set of structured providers I mentioned earlier, plus the ones that handle the more dynamic parts of the universe. Bombora for category-level intent. 6sense or Common Room for behavioral signals.
UserGems for relational signals like former customer movements. Each provider has an API, a query format, and a refresh cadence. The agent treats them as tools it can call and reason over the responses to.
The wiring is usually handled through n8n or a similar workflow runtime that gives the agent persistent state, scheduled execution, and integration with the downstream systems. The TAM dataset itself lives in your CRM, in HubSpot or Salesforce, with the agent reading and writing structured fields directly. That is the part that makes it operational. The dataset is not in a Notion doc. It is in the system your AEs and SDRs already work in, with the agent populating and ranking it continuously.
The output that matters
When the TAM Builder agent has been running for a few weeks, the artifact your team sees is not a TAM analysis. It is a continuously updated, ranked, enriched account universe inside your CRM that any other agent or any human rep can query against.
What that looks like in practice is a structured account list with the fit score for each one, the current signal status, the relevant trigger events from the last 30 days, the technographic profile, the relevant contact data, and the recommended action priority. A rep can filter to high-fit accounts with active intent signals in their territory and see exactly which accounts deserve attention this week. The intent signal architecture sits on top of this and feeds the trigger events in. The agent does the work of merging them into the account record.
The thing that surprises operators when they first see this running is how much the ranked output disagrees with their intuition. The accounts that score highest are often not the accounts the sales team was already chasing. The accounts that drop off the priority list often include logos the team thought were definitely buying this year. The dataset reflects the structured criteria from the ICP, not the storyline the team had in its head.
ICONIQ’s State of Go-to-Market data has documented this pattern across enough companies that it is no longer a surprise to people who have seen it. The first month of operating an agent-built TAM is a recalibration exercise for the whole revenue team.
What this replaces in the old workflow
The TAM Builder agent replaces a specific kind of analyst work that used to live somewhere between marketing operations, sales operations, and strategy. Someone at the company was running market sizing exercises every quarter or two. Someone was building account lists from spreadsheets and pulling enrichment data manually. Someone was deciding which segments to prioritize for the next quarter’s campaigns. The work was real, and the people doing it were skilled, but the work was also slow, expensive, and out of date almost as soon as it was finished.
The agent compresses this work in two dimensions. It runs continuously instead of quarterly, so the dataset never goes stale in the same way. And it runs at the scale of the entire universe rather than the subset a human analyst could realistically cover, so the long tail of accounts that used to fall outside the analyst’s bandwidth now get scored alongside the obvious ones.
The teams that have switched to agent-built TAM almost universally tell us the same thing about what changed. The mid-market accounts they used to skip because the analyst could not get to them are now in the top quartile of their pipeline.
The named accounts that used to dominate the priority list because somebody on the executive team mentioned them are now scored honestly against the actual ICP, and some of them drop off the list. The shape of the pipeline shifts toward the math and away from the politics. We have written elsewhere about how this compares to packaged AI SDR tools that try to do a thinner version of this work without the underlying TAM rebuild. The thinner version produces thinner results, predictably.
Where the TAM Builder sits in the agent chain
The TAM Builder is the first agent in the autonomous pipeline chain at every implementation I have seen work. The order matters. Every downstream agent depends on the universe that the TAM Builder defines.
The flow looks like this. The TAM Builder maintains the ranked, enriched, signal-aware account universe. The ICP scoring agent (which is sometimes the same agent and sometimes a distinct one) applies the weights and produces the operational priority list. The signal architecture watches the priority accounts continuously and surfaces trigger events.
The decision maker finder maps committees inside accounts that have trigger events. The persona and outreach agent drafts the touch against the right contact at the right moment. Each agent pulls from the layer below it. The TAM Builder is the layer everything else stands on.
Companies that try to build the agent chain without solving the TAM layer first end up with downstream agents operating on a fragile foundation. The decision maker finder maps committees inside accounts that should not have been on the list. The outreach agent crafts personalized messages to companies that left your ICP six months ago. The signal architecture lights up trigger events on accounts that do not matter. The infrastructure looks impressive in a demo and produces an unimpressive pipeline because the underlying dataset is wrong.
The GTM stack we build with Claude Code is structured around getting this layer right first. The build sequence is not a preference. It is a dependency chain, and the TAM Builder is at the top of it.
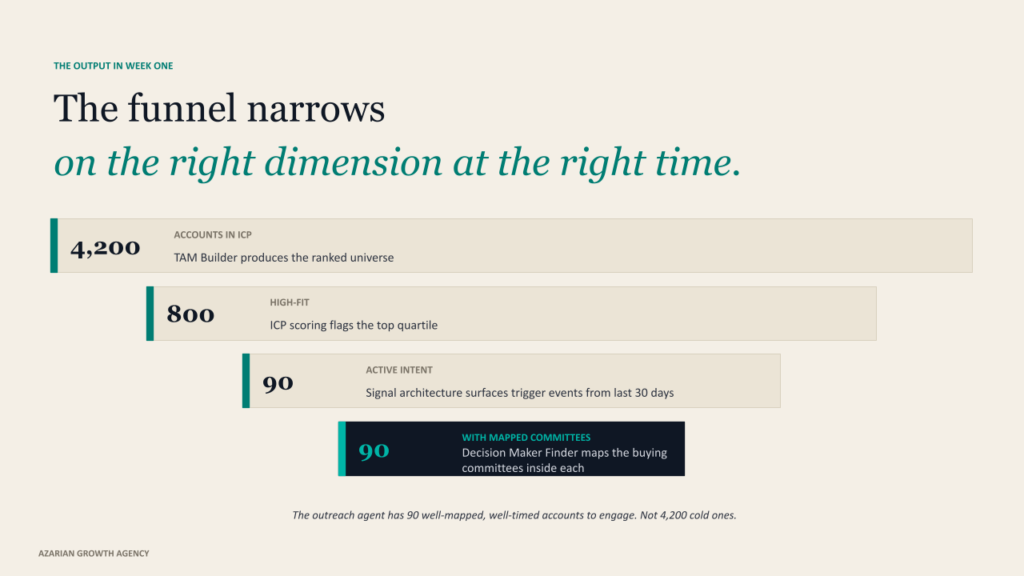
What this looks like in week one of operation is concrete enough to be worth describing. The TAM Builder produces a ranked universe of, say, 4,200 accounts in your ICP. The ICP scoring layer flags the top 800 as high fit. The signal architecture surfaces 90 of those 800 with intent activity in the last 30 days. The decision maker finder maps committees inside those 90.
The outreach agent has 90 well-mapped, well-timed accounts to engage instead of 4,200 cold ones. The funnel narrows on the right dimension at the right time, and the math works out very differently than it does with an undifferentiated list.
This is not theoretical. Every working agent chain produces some version of this funnel. The funnel only works if the TAM Builder did its job correctly at the top of it, which is why operators serious about this category invest disproportionately in this layer compared to the others.
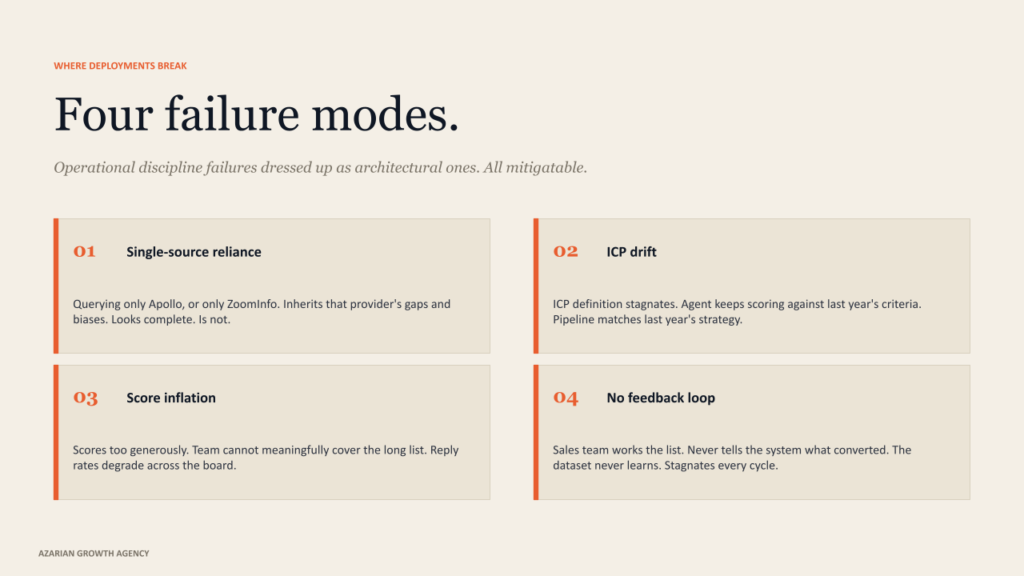
Common failure modes and how to avoid them
The honest version of any operational guide includes the ways it can go wrong. I have watched TAM Builder agents fail in three specific ways, and the failure modes are predictable enough to call out before you walk into them.
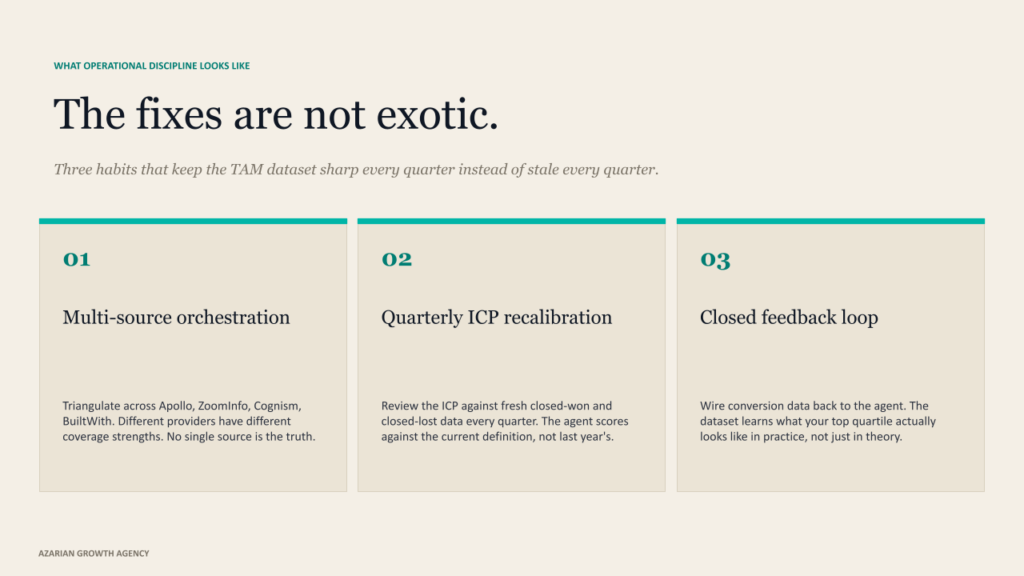
Over-reliance on a single data source. A TAM Builder that queries only Apollo, or only ZoomInfo, or only any single provider, inherits that provider’s gaps and biases. The data world is fragmented for a reason. Different providers have different coverage strengths across geography, company size, industry, and technographic dimensions. The agent’s job is to triangulate across them, not to delegate to one. Single-source TAM Builders produce account universes that look complete and are not.
ICP drift. The TAM dataset only stays useful if the ICP definition stays useful. If your team makes a strategic shift in segments, geography, or buyer type and the ICP does not get updated, the TAM Builder continues to score accounts against the old criteria. The agents downstream keep producing a pipeline that matches last year’s strategy. This is why the ICP needs to be treated as living infrastructure, with quarterly recalibration against current closed-won data.
Score inflation. A TAM Builder that scores too generously produces a long list of accounts the team cannot meaningfully cover. The agents downstream try to engage everyone, the system spreads itself thin, and reply rates degrade across the board.
The 95-to-5 rule from Ehrenberg-Bass is a useful corrective here. Only a small fraction of any market is in buying mode at any given moment. The TAM Builder should be ranking accounts honestly enough that the top quartile is actually actionable and the long tail is genuinely deprioritized. Generous scoring is just procrastinated triage.
No feedback loop from the sales team. The fourth failure mode is the one I see most often, and it is also the easiest to fix. The agent produces a ranked list, and the sales team works it without ever telling the system which accounts converted, which stalled, or which were a waste of time.
The TAM Builder cannot learn what your top quartile actually looks like in practice if no signal flows back to it. The fix is structural. Build a closed-won and closed-lost feedback channel into the agent’s quarterly recalibration. The dataset gets sharper every cycle when this loop exists and stagnates every cycle when it does not.
The failure modes are not exotic. They are operational discipline failures dressed up as architectural ones.
These are mitigatable. Multi-source orchestration, quarterly ICP review cadence, honest score calibration with feedback loops from the sales team. None of them are exotic. All of them require operational discipline, which is the part most teams underestimate when they build agent infrastructure for the first time.
The honest answer
A TAM Builder agent is not a market sizing exercise. It is the operational dataset that the rest of your autonomous pipeline system runs on. The slide your CFO put together is a different artifact for a different audience, and both can be true at once. You need both. They are not substitutes.
If you are about to invest in agent infrastructure for your GTM motion, build this layer first. Not because it is the flashy part of the system, it is not. Because everything else you build depends on it, and getting it wrong is the single most expensive mistake teams make in this space. The agents downstream cannot be smarter than the universe in which they are operating.
The teams that win this cycle are not the ones with the most sophisticated outreach agents or the most polished signal infrastructure. They are the ones who built a working TAM dataset first, treated it as living infrastructure, and let the rest of the agent chain compound on top of a foundation that actually reflects the market they sell into. The architecture rewards getting this right. The architecture is brutal about getting it wrong.
About Azarian Growth Agency
Azarian Growth Agency is an AI native growth marketing agency working with VC-backed founders, PE operating partners, and growth-stage B2B leadership teams. We build full funnel growth systems anchored on agent infrastructure, with 91 agents in production across client engagements as of 2026.
Our work spans pipeline diagnostics, TAM architecture, ICP design, decision maker mapping, intent signal infrastructure, and the broader stack of AI content marketing, AI-driven customer insights, and generative AI for marketing.
The Strategic Growth Diagnostic is the entry point for most engagements: a structured assessment of pipeline, CAC, signal infrastructure, and agent readiness, framed against the metrics PE and VC institutional buyers actually use.
I run a recurring live demo of the autonomous agent system that the agency builds for B2B clients.
The session walks through the full agent handoff in real time, starting from the TAM Builder agent that defines the operational account universe. Attendees see the prompts, the data flows, the verification checkpoints, and the metrics framework that ties the motion back to the pipeline and CAC payback.
The session is built for VC-backed founders, VPs of Sales, and operating partners evaluating GTM efficiency at the portfolio level.
Watch the live demo: Tech Week Boston autonomous agents pipeline session.