

Every roll-up model comes down to two numbers at exit: EBITDA and the multiple a buyer will pay. For most of the last decade, sponsors could lean on the second. Buy small, sell big, and let scale re-rate the whole. That still happens, but the math underneath it has changed. Bain reported in its 2026 Global Private Equity Report that a typical deal now needs roughly 10% to 12% average annual EBITDA growth to reach a 2.5x return over five years, compared with about 5% in the 2010s.
EBITDA improvement in a roll-up is the growth in combined earnings that comes from operating the platform better (pricing, commercial productivity, cross-sell, procurement, and shared services) rather than from adding acquired earnings. It counts twice at exit: once in the EBITDA figure, and again in the multiple, because buyers pay more for earnings that are organic, repeatable, and visible in clean data.
This piece ranks the levers by how fast they move earnings and how much they move the multiple, and covers what it takes to prove them to a buyer.
Key Takeaways
- Bain’s 2026 analysis found typical deals now need 10% to 12% annual EBITDA growth to reach a 2.5x return over five years, up from about 5% in the 2010s.
- Buyers do not value all EBITDA equally. Organic, repeatable, well-documented earnings earn a higher multiple than acquired or one-off earnings.
- Pricing is usually the fastest lever. McKinsey found a 1% price increase lifts operating profit by about 8% for a typical S&P 1500 company when volume holds.
- A lever only moves the multiple if the platform can prove it, which takes one data model rather than a quarterly consolidation exercise.
Why Does the Type of EBITDA Matter as Much as the Amount?
A buyer at exit does not apply one multiple to every dollar of earnings. Quality of earnings work separates EBITDA into what the buyer believes and what it discounts. Acquired earnings that were never integrated, one-time cost cuts, and unsupported add-backs all get marked down. Organic growth, recurring revenue, durable margins, and a diversified customer base get paid for.
The market has shifted toward the second category. Deloitte’s analysis of private equity alpha creation notes that leverage and multiple expansion drove over half of buyout value creation between the global financial crisis and the pandemic, and that revenue growth has since become the largest driver, at 65% to 70% of value creation in recent years.
Bain’s buy-and-build research makes the same point for roll-ups specifically. Across 44 buy-and-build deals, those relying on multiple arbitrage alone returned 1.4x MOIC, while those with a strategy driving organic growth or margin improvement returned 2.2x. EBITDA improvement that shows up as organic growth moves both numbers. Acquired EBITDA moves one.
What Are the EBITDA Levers in a Roll-Up?
Six levers account for most of the EBITDA improvement available to a platform. They differ in speed and in how much credit a buyer gives them.
| Lever | How It Moves EBITDA | Time to Impact | Effect on Exit Multiple |
|---|---|---|---|
| Pricing and discount discipline | Higher realized price on the same volume | Fast | Positive if durable and documented |
| Commercial productivity | More revenue per rep and per marketing dollar | Medium | Strongly positive; proves organic growth |
| Cross-sell across the combined base | New revenue from existing customers | Medium | Strongly positive; the synergy buyers pay for |
| Retention and churn reduction | Keeps revenue already won | Medium to slow | Strongly positive for recurring models |
| Procurement and vendor consolidation | Lower cost of goods and services at scale | Fast to medium | Neutral to positive |
| Shared services (finance, HR, IT) | Lower overhead per add-on | Medium | Neutral; expected rather than rewarded |
Timing is directional and varies by sector and platform maturity. The pattern that holds almost everywhere is that revenue-side levers earn more credit at exit than cost-side ones, because they are harder to fake and harder to reverse.
Why Is Pricing Usually the Fastest Lever?
Because it drops almost entirely to the bottom line. McKinsey’s analysis in The Power of Pricing found that for a typical S&P 1500 company, a 1% price increase with stable volume lifts operating profit by about 8%. That is nearly 50% more than a 1% cut in variable costs, and more than three times the effect of a 1% increase in volume.
Roll-ups have a specific version of this opportunity. Every add-on arrives with its own price book, its own discount habits, and its own sales team deciding what “standard” means. Harmonizing pricing across the platform is often the first meaningful gain after close. It needs data most add-ons do not have: realized price by customer, discount leakage by rep, and which customers are buying from more than one company in the group.
The risk is doing it blind. A price move applied to an overlapping customer who now sees two price books from sister companies can cost more than it gains. Map overlap first, then move. An outside-in commercial diagnostic on each add-on before close can surface pricing gaps and customer overlap, so the move is ready on day one rather than month six.
Know which levers a platform can actually pull before you commit to the plan. Our Strategic Growth Diagnostic maps pricing, attribution, CAC by channel, and pipeline quality, and returns board-ready findings with a prioritized 90-day action plan. See how the diagnostic works
How Do Commercial Levers Move Both EBITDA and the Multiple?
Three commercial levers do double duty. They add earnings and create evidence of organic growth that buyers pay a higher multiple for.
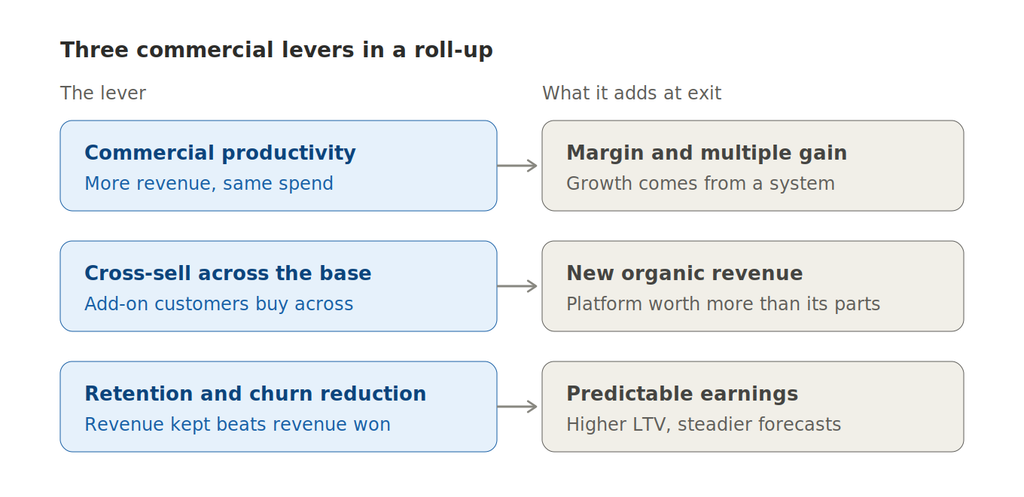
All three depend on the same foundation: one view of the combined customer base, one definition of pipeline, and marketing spend connected to revenue. Without that, cross-sell stays anecdotal, productivity gains cannot be measured, and churn gets discovered in the quarterly numbers instead of prevented.
Where Do Cost Levers Fit?
Procurement and shared services are real sources of EBITDA improvement, and they should happen early. Consolidating vendors across add-ons, renegotiating at platform scale, and centralizing finance, HR, and IT typically pay for themselves quickly.
But buyers expect them. A sophisticated acquirer assumes a platform of your size has already captured basic procurement and back-office synergies, so they rarely earn a premium. One-time cuts presented as ongoing margin improvement tend to get marked down in quality-of-earnings work. The practical approach: capture cost levers in the first year, use them to fund the commercial levers, and stop presenting them as growth once they are in the run rate.
The cost lever to handle most carefully is commercial spend itself. Cutting marketing and sales capacity lifts EBITDA in the quarter it happens and weakens the organic growth evidence buyers pay for at exit. Trim the spend that cannot be traced to revenue, and protect the spend that can.
How Do You Prove EBITDA Improvement to a Buyer?
A lever that cannot be shown is worth little at exit. Four things make the case.
Separate organic from acquired growth. Report same-company growth, excluding the first year of each add-on, alongside total growth. Buyers will do this themselves if you do not.
Track synergies by add-on. Modeled versus captured, quarter by quarter. Narrative updates are discounted.
Connect spend to revenue. Commercial productivity claims need attribution that ties marketing spend to closed revenue, not to leads.
Report from one data model. When every add-on reports in its own format, the combined picture takes weeks to assemble and is easy to challenge. One commercial view across every portfolio company, fed by consistent portfolio-level reporting, is what turns EBITDA improvement into an exit story a buyer can verify.
Which Levers Should Come First?
Sequence matters as much as selection. A workable order for most platforms:
- Pricing and procurement in the first two quarters. Fast gains that fund everything else.
- Commercial engine by the end of year one. Shared CRM, shared pipeline definitions, and a demand program that includes search and AI visibility for the combined brand.
- Cross-sell once customer data is merged. Not before, or you end up with sister companies quoting against each other.
- Retention as a standing program. Measured monthly, owned by a named leader.
Two conditions make the sequence work. Someone has to own the commercial levers at the platform level, whether a permanent hire or a Fractional CMO while the role is scoped. And pipeline assumptions have to be real, since coverage ratios inherited from add-ons often do not survive contact with the combined data.
The levers should also live inside the value-creation plan, with each one tied to a metric the board reviews. For private equity firms building a platform strategy around add-ons, that difference is between EBITDA improvement that is claimed and EBITDA improvement that is priced. It is also the approach behind Growth OS, the AI-native operating platform Azarian Growth Agency runs for PE firms: levers, metrics, and reporting on one set of records, with specialized agents supervised by senior operators who own the outcome.
See the unified commercial view live at SF Tech Week and LA Tech Week, October 2026.
Hamlet Azarian will demo Growth OS with real portfolio-level commercial data, from CIM screening to unified portfolio reporting, on one system. This is not a slide deck. If you’re a GP, operating partner, or deal team lead evaluating what AI-native operations infrastructure actually looks like at PE quality, this is the session to attend.
About the Author: Hamlet Azarian is the founder of Azarian Growth Agency. He advises PE operating partners and deal principals on commercial diligence, growth infrastructure, and revenue system design for PE-backed platforms.
Resources
- Bain & Company via PR Newswire. Private Equity Resurgence Gathers Steam as New Era Challenges Firms to Enhance Value Creation. February 23, 2026.
- McKinsey & Company. The Power of Pricing. McKinsey Quarterly.
- Deloitte. Private Equity Alpha Creation. 2026.
- Bain & Company. Building a Stronger Buy-and-Build. Global Private Equity Report 2024.