

PE operating partners know the feeling: eight portfolio companies, eight different CRMs, eight dashboard logins, eight versions of “revenue is looking good.” None of them speak the same language, and none of them give you what you actually need — a single, reliable commercial view across your entire portfolio, right now.
The problem isn’t that portfolio companies don’t have data. It’s that the data is trapped in systems that were never designed to report upward. Marketing dashboards built for a CMO don’t roll up to an operating partner overseeing a $400M portfolio. And stitching eight company-level reports together in a spreadsheet every quarter is not a system — it’s a workaround that breaks the moment one CFO changes their reporting cadence.
This guide is for the operating partner who has stopped pretending that portfolio reporting is a solved problem. We’ll break down why the commercial visibility gap persists across hold periods, what a real unified view looks like at the infrastructure level, and how PE firms are building it now — without asking every portfolio company to rip and replace their tech stack. We’ll also share how Azarian Growth Agency is bringing this framework live at SF Tech Week and LA Tech Week this October.
Why Can’t Operating Partners Get a Straight Answer on Commercial Performance?
The commercial visibility gap is one of the most consistent operational problems in private equity — and one of the least discussed. Every firm has it. Few have fixed it.
The root cause isn’t a data problem. Portfolio companies generate enormous amounts of commercial data: pipeline, CAC, churn, NRR, channel mix, campaign spend. The issue is structural. Each company built its reporting for its own internal needs, and those needs don’t align with what an operating partner needs to see across companies and across quarters.
Here’s what the gap looks like in practice. An operating partner overseeing five portfolio companies in a B2B SaaS-adjacent cluster needs to know: which company is acquiring efficiently, which one is burning cash on dead channels, and which one is quietly outperforming on retention. Getting that answer takes calls with five different CMOs, five different spreadsheet exports, and a week of reconciliation. By the time the picture is assembled, it’s already out of date.
The gap compounds over the hold period. In the deals we see, the first 90 days usually run on founder-provided data and gut instinct, and marketing infrastructure gets standardized — if at all — in year two, when time pressure has already reduced the window to drive multiple expansion before exit. The firms that close this gap in the 100-day plan are the ones that have the clearest view of which levers to pull at exit prep.
There’s also a talent dimension. Middle-market PE firms typically operate with lean deal teams and limited internal research support. Asking a two-person operating partner team to synthesize commercial data from eight companies every month is not realistic. The firms that solve this problem do it with infrastructure, not headcount.
What Does a Real Unified Commercial View Actually Require?
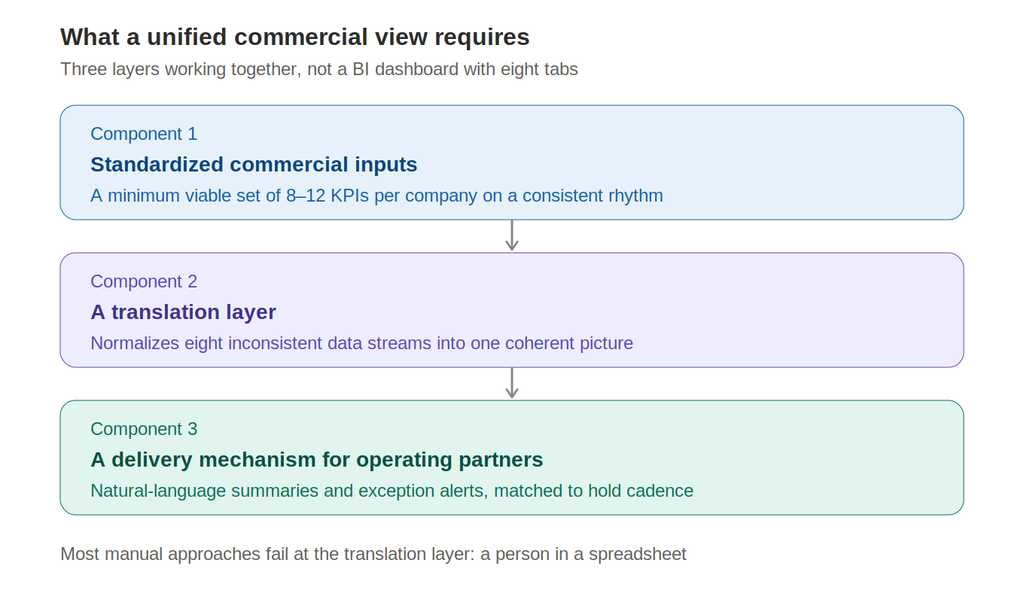
A unified commercial view is not a BI dashboard with eight company tabs. That’s a reporting convenience, not a system. A real unified view requires three things working together: standardized commercial inputs across portfolio companies, a layer that translates those inputs into a common language, and a delivery mechanism that surfaces the right signals to the right people without requiring manual assembly.
Let’s break each one down.
Standardized commercial inputs. This means every portfolio company is tracking the same core commercial KPIs in a format that can be ingested centrally. It does not mean every company runs the same CRM — that’s an unrealistic ask for a portfolio with companies at different maturity stages. It means agreeing on a minimum viable set of commercial metrics — pipeline velocity, CAC by channel, churn rate, NRR — and establishing a reporting rhythm that delivers them consistently. For most portfolios, 8–12 metrics per company is the right level of granularity. More than that and you’re running a metrics program, not an operating view.
A translation layer. Raw data from eight different source systems will not line up cleanly. HubSpot and Salesforce define pipeline stages differently. One company tracks CAC on a 30-day basis; another uses a 90-day blended figure. A translation layer — whether that’s a data warehouse, a standardized ETL pipeline, or an AI layer that normalizes outputs — is what turns eight inconsistent data streams into one coherent commercial picture. This is where most manual approaches fail: the translation is done by a person in a spreadsheet, which means it breaks whenever the person changes or the source system updates.
A delivery mechanism for operating partners. The output has to reach operating partners in a format they will actually use. That means natural language summaries, not dashboards full of charts. It means exception alerts — “Portfolio Company 4 is down 22% on MQL volume this month, here’s why” — not passive reports they have to remember to pull. And it means the delivery cadence has to match how operating partners actually work: weekly for the active holds, monthly for the stable ones, real-time for anything with an upcoming board meeting or exit timeline.
Building all three of these layers is not a technology project. It’s a commercial operations decision. The firms that have done it treat it as core infrastructure — the same way they treat financial consolidation. The ones that haven’t are still reconciling spreadsheets.
Want a unified commercial view across your portfolio — without asking every company to change their stack?
Azarian Growth Agency builds the translation layer and reporting infrastructure for PE firms. We’re showing exactly how this works — live, on sample portfolio data — at SF Tech Week and LA Tech Week this October.
What Does the Commercial Infrastructure Stack Look Like for a PE Portfolio?
PE firms that have built a real unified commercial view typically arrive at a similar infrastructure stack, regardless of portfolio size or vertical focus. It has four layers, and understanding what each layer does — and what happens when it’s missing — is the fastest way to diagnose where your current setup breaks down.
For more on how leading PE firms approach this problem, see our full breakdown of how PE firms build marketing infrastructure that survives the hold period.
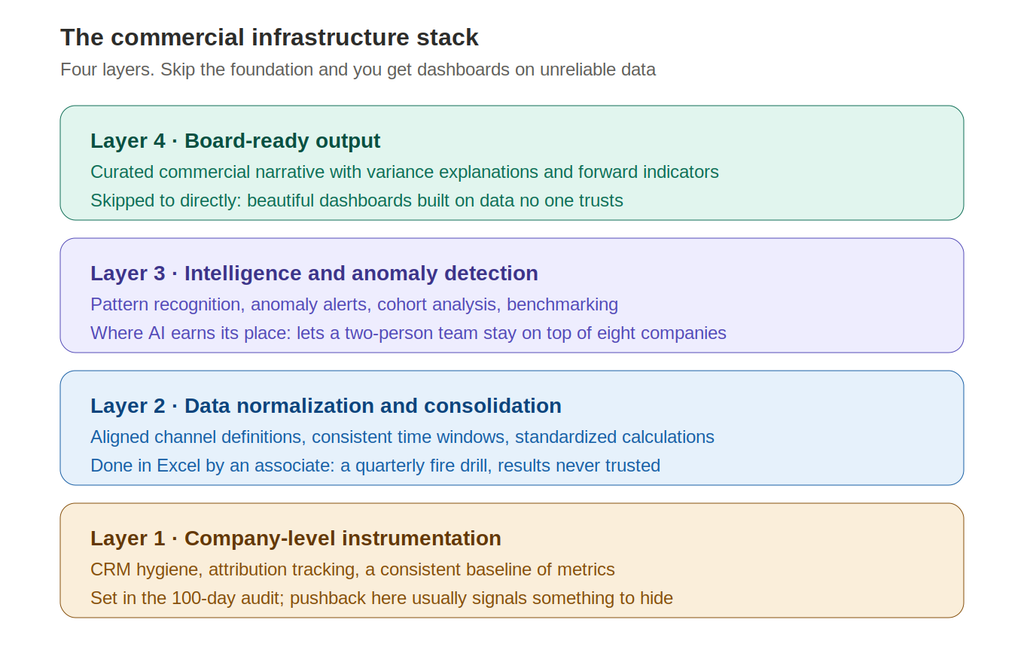
Layer 1: Company-level commercial instrumentation. Each portfolio company needs to be instrumented to produce consistent commercial signals. This means CRM hygiene standards, attribution tracking, and a baseline set of marketing metrics being measured in a consistent way. The operating partner’s team doesn’t usually set this up directly — it’s established through the 100-day commercial audit and maintained through a quarterly check-in process. Companies that push back on instrumentation are usually the ones with the most to hide in their pipeline data.
Layer 2: Data normalization and consolidation. This is the unglamorous middle layer that most firms skip. It involves pulling data from each company’s source systems, applying normalization rules (aligned channel definitions, consistent time windows, standardized metric calculations), and loading the output into a central data store. Done right, this layer runs automatically. Done wrong — which usually means “done in Excel by an associate” — it becomes a quarterly fire drill and the results are never trusted anyway.
Layer 3: Intelligence and anomaly detection. Raw normalized data is still just data. The intelligence layer is what converts it into decisions. This is where AI earns its place in the PE stack: pattern recognition across portfolio companies, anomaly detection (“Company 3’s CAC jumped 40% in Q3 — here’s what changed”), cohort analysis, and benchmarking against both internal portfolio performance and external sector norms. The intelligence layer is what allows a two-person operating partner team to stay on top of eight companies without being buried in reports.
Layer 4: Board-ready output. The final layer translates intelligence into formats that work in board meetings, LP updates, and investment committee discussions. This is not the same as a management dashboard — it’s a curated view of the commercial narrative for each company, with variance explanations and forward indicators baked in. Operating partners who get this layer right stop spending the week before board meetings assembling materials and start spending it deciding what to say.
The full stack can be built modularly over a 6–12 month period. Most firms start with Layer 1 standardization in the first 100 days of each acquisition, then layer in consolidation and intelligence as the portfolio matures. The ones that try to skip directly to Layer 4 without the foundation end up with beautiful dashboards built on unreliable data — a common and expensive mistake.
How Do You Build Commercial Visibility in the First 100 Days Post-Acquisition?
The 100-day post-acquisition period is the highest-leverage window for establishing commercial visibility. Founders and management teams are in listening mode. Reporting structures haven’t calcified yet. And the firm has maximum credibility to make infrastructure requests that would face pushback at 18 months.
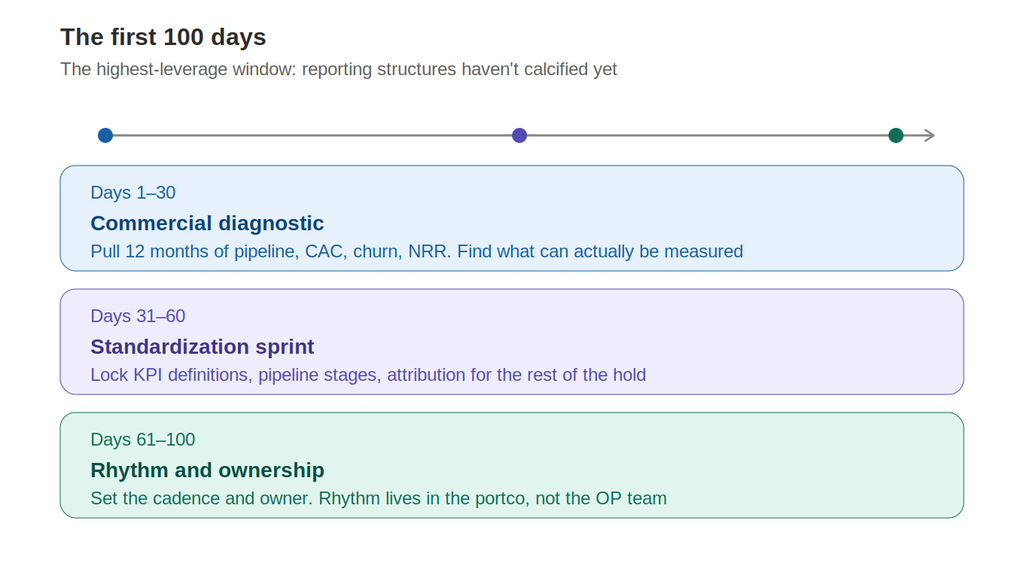
Our guide to how PE firms build marketing infrastructure covers the full audit. The short version we use: days 1–30 are about diagnosis, days 31–60 are about standardization, and days 61–100 are about establishing the reporting rhythm that will carry through the hold period.
Days 1–30: Commercial diagnostic. The goal is a clear-eyed picture of what the company actually knows about its commercial performance — not what it reports, but what it can reliably measure. Pull the last 12 months of pipeline data, CAC by channel, churn cohorts, and NRR. Benchmark against sector norms. Identify the 3–5 metrics that are tracking well and the 2–3 that are broken or unmeasured. This is not a PowerPoint exercise — it’s a data pull, and it will reveal whether the company’s CRM is actually being used.
Days 31–60: Standardization sprint. Lock in the commercial KPI definitions the company will use for the remainder of the hold period. Define pipeline stages. Align on attribution methodology. Establish the minimum viable reporting set that will feed the portfolio-level view. Bring in external support if the internal marketing team doesn’t have the ops capability to do this cleanly — it’s worth the cost to get it right in month two rather than rebuilding it in year three.
Days 61–100: Rhythm and ownership. Establish the reporting cadence. Who delivers the commercial report, and when? Who owns the data quality? What happens when a metric breaks or goes dark? This is the operational design that most firms skip — and then wonder why their commercial reporting degrades after year one. The rhythm has to be owned inside the portfolio company, not managed by the operating partner team. The operating partner’s job is to receive clean data and act on it, not to chase it down.
For most acquisitions, the 100-day commercial setup is the single highest-ROI investment the operating partner team makes. It’s also the most commonly skipped — because the first 100 days are consumed by financial integration, management assessment, and quick wins. The firms that protect time for commercial infrastructure setup in the 100-day plan are the ones that have a real unified view at year two.
What Does Good Portfolio-Level Reporting Look Like at Scale?
Once the commercial infrastructure is in place at the company level, the question becomes: what does the portfolio-level view actually look like, and how does it drive decisions at the firm level?
The best portfolio commercial reports have three properties. They’re exception-driven, not exhaustive. They’re forward-looking, not backward. And they’re actionable within the meeting they’re presented in.
Exception-driven. An operating partner reviewing eight companies doesn’t need to see every metric for every company. They need to know what’s off-plan, what’s accelerating beyond forecast, and what’s approaching a decision point. The report should surface the top 3–5 commercial exceptions across the portfolio each period — and suppress everything that’s tracking as expected. The noise-to-signal ratio in most portfolio commercial reports is inverted: too much green, not enough explanation of the amber and red.
Forward-looking. Commercial reports that only show what happened last quarter are retrospective management tools, not operating partner tools. The operating partner’s job is to make decisions about the next quarter and the next year. Portfolio-level reporting should include leading indicators — pipeline coverage ratios, channel efficiency trends, early churn signals — not just lagging outputs like revenue and EBITDA margin. Leading indicators are what allow the operating partner to intervene before a commercial problem becomes a financial one.
Actionable in the room. If a board meeting ends without a clear decision on each commercial exception item, the reporting system has failed. Good portfolio commercial reports are structured so that each exception includes a proposed response — not a recommendation for further analysis, but a specific intervention: reallocate channel budget, replace the CMO, bring in an external demand gen resource, accelerate a product launch. The RevOps framework that aligns sales, marketing, and customer success applies directly here — the operating partner’s commercial view should be the equivalent of a RevOps system at the portfolio level.
Firms that get this right move faster. They don’t spend the first 45 minutes of a board meeting assembling a shared understanding of where the company stands commercially. They spend it on the decision. That time compression — from diagnosis to decision — is the real compounding return on commercial visibility infrastructure.
How Does Growth OS Deliver Portfolio-Wide Commercial Visibility?
Growth OS is the operating system Azarian Growth Agency built to run marketing, sales, and commercial operations from one platform. For PE firms, it delivers exactly the four-layer commercial infrastructure stack described above — without requiring every portfolio company to migrate to a new CRM or rebuild their reporting from scratch.
The platform has run in production since April 2026. As of late September 2026 it runs more than 20 scheduled agents on more than 40 automated schedules, connected to more than 50 integrated services. It is not a proof of concept. It runs the same workflows AGA uses to operate its own pipeline and its clients’ commercial reporting, and every output is traceable to its source data.
For a PE firm, Growth OS runs across two tracks simultaneously. The first is firm-level operations: CIM screening and deal intelligence, LP fundraising intelligence, and a deal database that works as institutional memory. The second is portfolio-level commercial visibility: standardized commercial tracking across portfolio companies, automated normalization and consolidation, AI-driven anomaly detection, and board-ready commercial reporting without the manual assembly.
The core capability that operating partners respond to most directly is what we call the unified commercial layer. It connects to each portfolio company’s existing CRM and analytics, normalizes the commercial outputs to a consistent framework, and delivers portfolio-level intelligence in plain language.
This is fundamentally different from buying eight SaaS subscriptions and trying to make them talk to each other. Growth OS is not a platform wrapper — it’s production-grade infrastructure built specifically for the operating model of a PE firm managing multiple portfolio companies across a 3–7 year hold period.
If you are weighing outside help to build this, our guide to choosing a private equity marketing agency covers what to look for and what to ask before you hire.
See the unified commercial view live — at SF Tech Week and LA Tech Week, October 2026.
Hamlet Azarian will run Growth OS live on stage, from CIM screening to diligence. This is not a slide deck. If you’re a GP, operating partner, or deal team lead evaluating what AI-native operations infrastructure actually looks like at PE quality, this is the session to attend.