Facebook is the World’s largest social networking platform, with over 2 billion active users.
With such a huge audience, advertising on Facebook may be a powerful tool for businesses to reach their target market and drive conversions.
Facebook offers a variety of ad formats and targeting options, making it a flexible platform for businesses of all sizes and industries.
However, just like with any form of advertising, it is crucial to have a solid understanding of industry benchmarks and best practices in order to optimize your campaigns and achieve the best results.
To help with this, we, a leading Facebook Ads Agency, have compiled a list of some key Facebook ad stats and benchmarks that can improve your performance.
By understanding and utilizing these Facebook ad stats, you can adjust your Meta ad strategy using ad automation to better align with industry averages and improve the effectiveness of your campaigns.
So, let’s cut to the chase and dive into the numbers.
2.91 Billion People Use Facebook Every Month

Currently, Facebook is the most used online social network worldwide, with approximately 2.96 billion monthly active users as of the third quarter of 2022.
This statistic underscores one of the crucial Facebook ad stats: the immense potential for reaching a vast and diverse audience through effective Facebook advertising strategies.
Facebook is One of the World’s Most Valuable Brands, Coming in at 7th Place
Apple, which has an estimated brand value of $263.4 billion USD, is in the top spot.
Facebook is right behind huge brands like Amazon and Google, taking 7th place for 2021 with a brand value of $81.5 billion.
The Average Cost-Per-Click (CPC) on Facebook is $1.86
The cost-per-click (CPC) of a Facebook ad varies depending on the business and industry but overall averages $1.86.
This figure is one of the key Facebook ad stats that highlights how costs can vary by industry, with food and drink having the lowest CPC at 42 cents and internet and telecom having the highest at $3.07 per click.
On Average, Facebook Ads Have a Conversion Rate of 9.21%
A recent study from Wordstream found that the average conversion rate on Facebook ads is 9.21%.
Of all sectors, fitness had the highest conversion rate at 14.29%, followed by education at 13.58%. Technology had the lowest conversion rate at 2.31%.
260 Million Americans will be Using Facebook by 2027
According to Statista, the estimated number of Facebook users in the U.S. is projected to grow to 260 million by 2027.
This is a promising trajectory for businesses looking to market their products and services on the platform.
Asia has 1.2 Billion Active Users on Facebook

Facebook users in the Asia-Pacific region have increased significantly over the past few years.
According to Statista, 1.28 billion people were using Facebook monthly as of the fourth quarter of 2021.
This is compared to only 390 million people who were using Facebook monthly in the first quarter of 2014.
The Overwhelming Majority of Facebook Users- 98.3%- Access the App through Mobile Device
Facebook is the most popular social network globally, and it can be accessed via multiple mobile apps or its mobile website.
In January 2021, nearly 98 percent of active user accounts worldwide used a mobile phone to access the social network.
Women Make up 9.3% of Facebook Users, while Men Amount to 18.4%

According to a study done in January 2022, 9.3% of Facebook users were women aged 18-24, while the largest demographic group on the site consisted of men aged 25-34.
A Staggering 8 Million Advertisers are Utilizing All Facebook (Meta) Platforms
Being the most widely used social media platform, it’s no surprise that Facebook also has the largest pool of advertisers.
This is one of the impressive Facebook ad stats, showcasing how Facebook, Instagram, and WhatsApp collectively attract the largest pool of active advertisers across all Meta platforms.
Facebook’s Total Ad Revenue Generated was Around 28.3 Billion U.S. dollars in 2021
Statista reports that Facebook’s advertising revenue in the third quarter of 2021 amounted to approximately 28.3 billion U.S. dollars, while other revenue streams generated 734 million U.S. dollars in revenues.
51% of Facebook Users Prefer Video Content that is In-Feed
In-feed Facebook videos are the most commonly watched type of content on the site, with 51% of users partaking.
Facebook video is the most famous type of content on the platform, with 51% of users preferring it to Live (24%) and Watch (23%) options.
50% of the Marketers Recommend Posting on Facebook 2-3 Times per Week
A recent survey conducted by Databox revealed that 50% of marketers believe that posting on Facebook 2-3 times per week is ideal in order to maximize reach and engagement with target audience.
This frequency allows for consistent communication without overwhelming followers with constant updates.
People Using Facebook are 1.5 Times More Likely to Watch Videos on Their Smartphones Every Day than on Computers
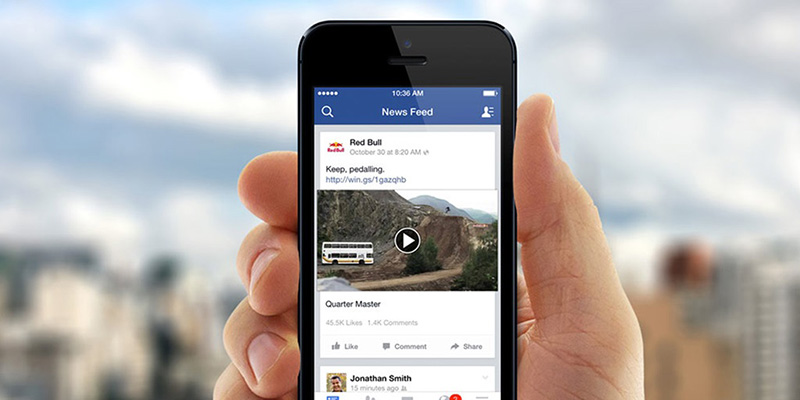
Video is not going anywhere anytime soon. The World loves video, and with good reason- it’s informative and engaging.
As we look ahead, we see that mobile devices and Millennials are only going to increase the demand for video content.
According to Facebook, people are 1.5x more likely to watch videos every day on a smartphone than on a computer.
A Majority of Marketers (58%) Use Facebook as a Platform to Post Videos
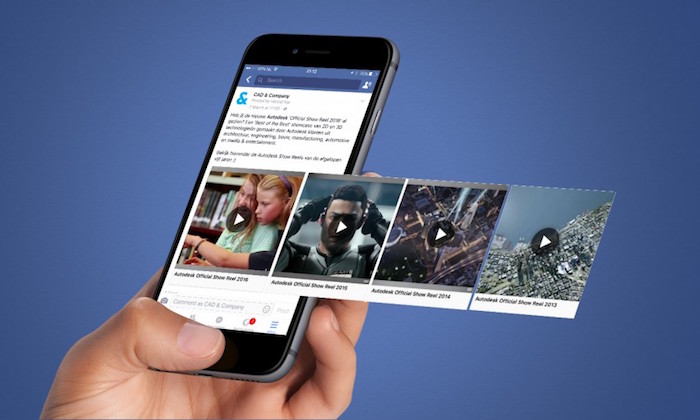
Facebook is the top platform for regularly publishing videos (58%), followed by Instagram (49%) and YouTube (47%).
This shows the importance of investing time and resources into creating engaging video content for social media.
Facebook Stories has 500 Million Viewers Every Day
Techcrunch reports that Snapchat-style stories now have 500 million users each day on Facebook and Messenger.
WhatsApp’s feature Status has 500 million dailies as well, while Instagram hit that mark three months ago.
This is significant because it means 1/3 of Facebook’s 1.56 billion daily users are posting or watching these Stories, which only began two years ago.
A Large Majority of Businesses (81%) Prefer Video Marketing on Facebook
With video content becoming increasingly popular among brands, Facebook still remains the most used channel for sharing business videos (81%).
YouTube falls in second place with 62%, and Instagram follows closely behind with 57%.
31% of Americans Say that Facebook is Their Primary Source of News
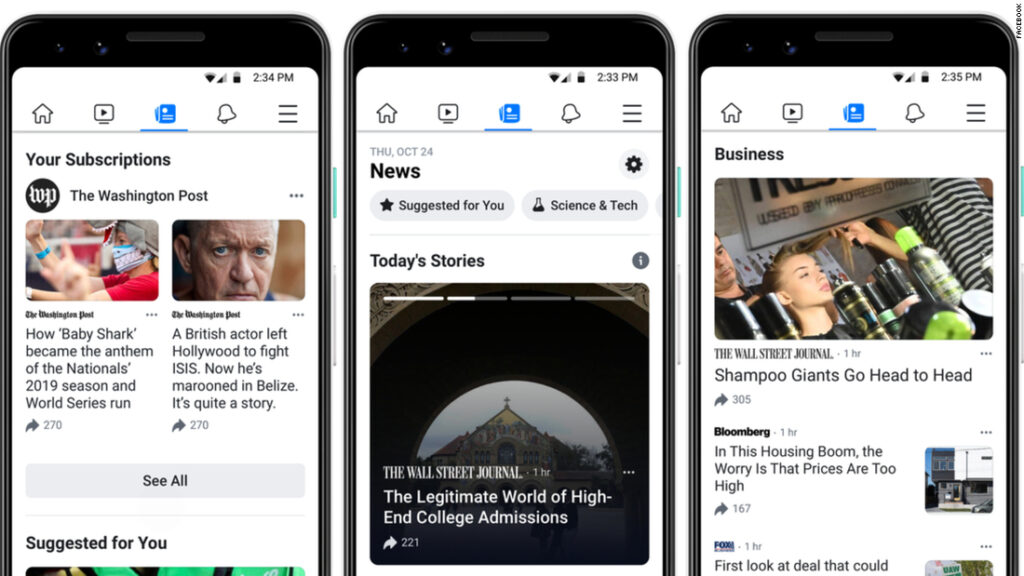
A third of American adults regularly get news from Facebook, while 22% say they regularly receive news updates from YouTube.
Twitter and Instagram are also popular sources for receiving breaking news, with 13% and 11% of users, respectively, getting their information this way.
Facebook’s Advertising Platform is Utilized by over 3 Million Businesses
Nowadays, three million businesses actively advertise on Facebook from all corners of the earth. More than 70% of these companies are based outside of the U.S.
Even though they come from different industries and walks of life, each business has a story and mission that is unrivaled by anyone else in their field.
The Average Small Business Spends $500-$1,500 per Month on Facebook Ads
Facebook is a popular advertising tool for both large and small businesses.
While small businesses typically spend between $500 and $1,500 monthly on Facebook advertising, there is no minimum monthly ad spend required, meaning advertisers are free to spend any amount they choose.
The Average American Adult Spends 33 Minutes on Facebook Every Day

The coronavirus outbreak had a large impact on how much time people spend on various social media platforms.
In January 2021, the average American spent 33 minutes on Facebook every day, which was more than any other platform.
TikTok and Twitter were the second and third most used platforms, respectively.
The Overwhelming Majority of Facebook Users, 98.5%, Access the Site through Mobile Devices
Facebook is still the World’s leading social media platform, and it doesn’t seem to be slowing down anytime soon.
In fact, a big reason why people are spending more time on their phones every day is because of Facebook.
Almost everyone who uses Facebook (98.5%) accesses it through mobile devices, which means you can scroll through your newsfeed no matter where you are.
Only 1.5% of Facebook Users Access the Platform Exclusively through a Laptop or a PC

The number of users who visit Facebook only from a laptop or desktop computer is low, at 1.5%.
This is due to the increasing popularity and accessibility of mobile devices, such as smartphones and tablets.
The Top Category of Facebook Stories is Politics, at 36%
As of March 2019, the top 100 Facebook stories worldwide were predominantly related to politics, making up 36 percent of interactions.
India has the Most Facebook Users in the World, with a Grand Total of 320 Million People
India has the highest population of Facebook users at 239.65 million, followed by the United States with 179.65 million, Indonesia with 129.85 million, and Brazil with 116 million users.
In 2019, 15% of Facebook Users Utilized the Site to Look for and Buy Products
Facebook is one of the most well-known social media platforms, and people use it for different purposes.
Some use it to stay in touch with friends, and some share pictures or events, while others use Facebook as a shopping platform.
In 2019, 15% of Facebook users didn’t just browse idly- they used the site to window shop and make purchases.
62% of People Said Facebook Stories have Strengthened Their Relationships with Brands
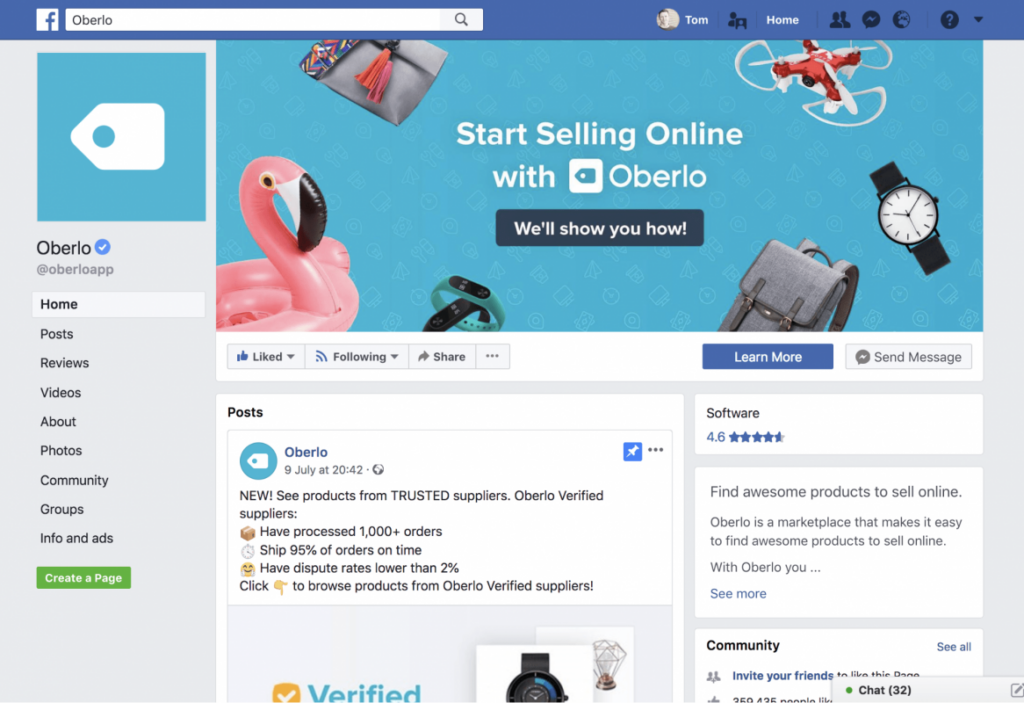
Stories are a great way for people to connect with brands—and they’re only going to become more popular.
62% of people who use stories across the Facebook family of apps said they’ve become more interested in a product/brand after seeing it in stories.
The Top 5 Most Popular Used Call-To-Action Buttons on Facebook Ads are Learn More, None, Shop Now, Sign Up, Book Travel
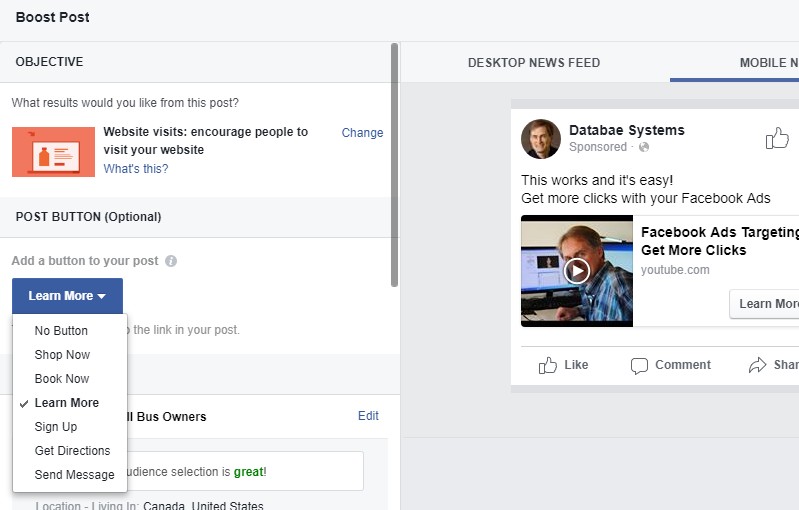
Picking the perfect CTA is more complex than you might think, which explains why this category has changed a lot in recent years.
Marketers have tried many different types of CTAs, including no button at all.
The five most popular call-to-action buttons that marketers use on Facebook ads are Learn More, None, Shop Now, Sign Up, and Book Travel.
The Average Length of a Facebook Ad Description is 18 Words
The average link description was 18 words in 2015, but only three years later, it decreased to 13.
In fact, Facebook has announced that the average attention span of a human is only 8 seconds. Thus, it is important for marketers to be concise and grab the reader’s attention quickly.
By 2022, it is estimated that Facebook Ads in the U.S. will Grow by 15.5% Year-over-Year
According to eMarketer, U.S. ad revenue is expected to surpass $58.1 billion by 2022 – a 15.5% increase from the previous year.
Usually, annual growth rates are not as drastic; however, 2020 saw a surge in e-commerce due to pandemic lockdowns that halted in-person shopping habitually for many people worldwide.
85% of Facebook Videos are Consumed without Any Audio
The audio you choose to add to your video can make a big difference. However, Facebook is not always a place where people have their volume turned on.
Instead, they often scroll through their feed with the sound off. In fact, a whopping 85% of Facebook videos are played without any audio.
Facebook is the Most Important Social Platform for 67% of B2C Marketers, while only 55% of B2B Marketers Claim the Same
Compared to B2B marketers, a higher percentage of B2C marketers are interested in learning about Instagram (76% B2C vs. 63% B2B) and Facebook (67% B2C vs. 55% B2B). This highlights the varying priorities between Facebook ads B2B and B2C strategies.
Conversely, 71% of surveyed LinkedIn users were found to be B2B-oriented, while only 52 percent expressed interest in being part of the B2C market.
52% of Marketers Find that Video Ads Perform Better on Facebook than Image Ads
Out of the marketers who responded to Databox’s survey, 52% said they use video more often than images, while the remaining 48% said the opposite.
The Majority of Ads, 69%, Link to a Landing Page
69% of Facebook ads point users to a landing page or a specific referral on the product website.
This is a key insight from Facebook ad stats, showcasing that most advertisers prefer focused landing pages to enhance conversion rates.
11% direct users to the home page, while 20% send users to another page within Facebook.
When It Comes to Short-Form Videos, Facebook Prevails over TikTok by 60.8% User Share
Out of all social media platforms in the U.S. that allow users to watch short-form content, YouTube is number one, with almost 78% of people ages 16 and up going there to stream videos less than 10 minutes long.
In second place is Facebook, with just over 60%, while coming in third is TikTok, with a little under 54%.
By 2022, the number of People Using Facebook Messenger in the United States is Expected to Reach 138.1 Million
By 2022, it is projected that 138.1 million mobile phone users in the U.S. will use the messaging app to communicate- an increase from 126.3 million users in 2018.
Facebook Tends to Disapprove Ad Images that Have More than 20% of Text
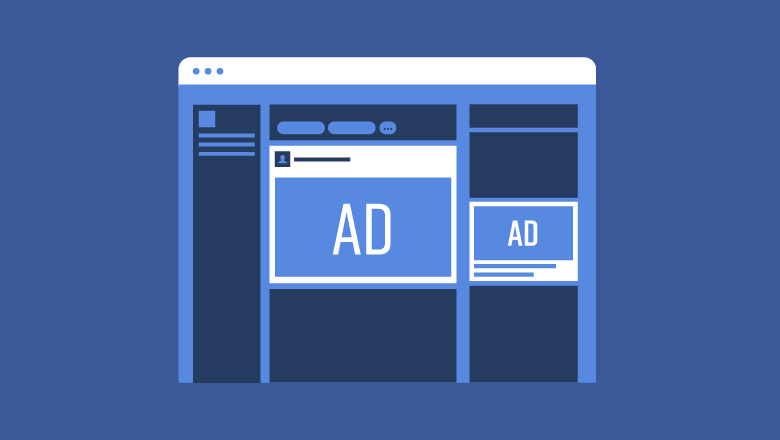
For the best results, your image should have minimal text – 20% or less of the image.
If you fail to adhere to this guideline, your ad may not be approved.
There are around 250 Million Facebook Shops Worldwide
In 2016, Mark Zuckerberg created Facebook Marketplace as a space for users to buy and sell items directly through social networks.
In 2021’s first quarter, over one billion global monthly users were recorded by the company.
In 2020, again betting on e-commerce, Facebook added Facebook Shops. Facebook Shops allows small businesses to present product catalogs similar to an online store.
From January to March 2021, Facebook shops reported approximately one million monthly global users and around 250 active stores worldwide.
Most of Your Facebook Post’s Engagement (75%) Occurs within the First 5 Hours
Post Planner’s research shows that most of the engagement you’ll receive on Facebook posts is within the first 5 hours.
Engagement dies down significantly after those initial 5 hours.
As of Q3 2020, over 10 Million Advertisers Used Facebook
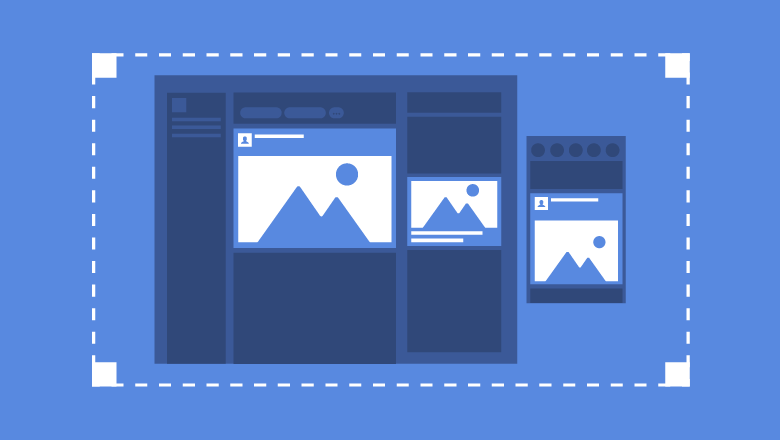
As of the third quarter of 2020, 10 million advertisers were using Facebook to promote their products and services.
This number is up from seven million during the first quarter of the year prior.
5% of Facebook Users are Aged 65 or Older
Statista reports that in January 2022, 5% of Facebook users were aged 65 or older.
A Majority of U.S. Adults Earning more than $70k Use Facebook Regularly
The usage of the major social media platform – Facebook, is higher among those with higher education and income.
According to Pew Research Institute, U.S. adults who earn more than $70k use the Facebook platform every day.
Every Month, 1.8 Billion People Use Facebook Groups
More than 1.8 billion people use Groups every month, creating one of the largest online communities. This immense engagement highlights the potential of Facebook ad stats in reaching and connecting with diverse audiences effectively.
Facebook Reels are Now Available in 150 Countries
Facebook announced that they’re expanding the availability of Facebook Reels to more than 150 countries.
They’re also introducing new ways for creators to generate money, new Meta tools, and even more places to watch and create Facebook Reels.
1 in 5 Videos on Facebook is Now a Live Broadcast
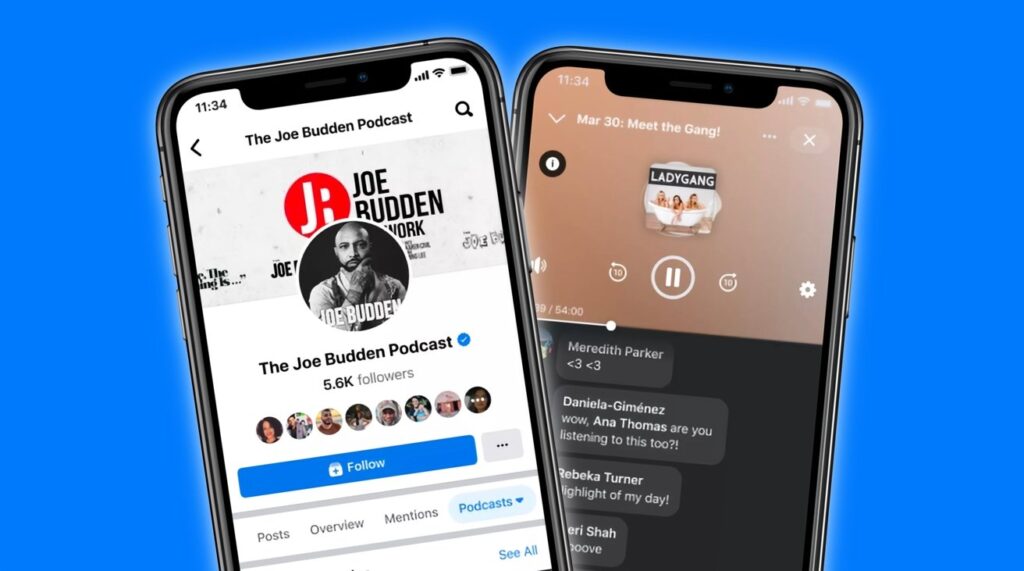
People have always enjoyed sharing experiences, even when they weren’t able to be in the same place.
With live broadcast technology, users can now bring those experiences to their friends and family in real-time.
According to Facebook ad stats, 1 in 5 videos on the platform are now live broadcasts. This suggests that more and more people are sharing their experiences with their community through live videos.
Facebook Discovered that a Whopping 80% of Users Have Negative Reactions to Videos that Automatically Play with Sound
Facebook conducted research and found that when feed-based mobile video ads play loudly without warning, 80% of people react negatively. This reaction is directed both toward the platform itself and the advertiser.
When creating video ads, advertisers should keep this in mind and ensure their stories don’t require sound to communicate their message.
57% of U.S. Residents Say Stories Make Them Feel Like Part of a Community

People love Stories and the sense of community it brings.
In fact, according to Facebook, a whopping 57% of all people in the United States say that stories make them feel as if they’re part of a larger community.
This highlights one of the key Facebook ad stats: leveraging Stories can significantly enhance user engagement and foster a stronger connection with your audience.
Start Improving Your Facebook Ad Performance Today
So, there you have it- 46 Facebook ad stats and benchmarks that can help improve your performance on the World’s largest social media platform.
Facebook advertising can be a powerful and essential tool for businesses of all sizes, but it’s important to keep track of key metrics and benchmarks in order to optimize your campaigns.
By staying up to date on these Facebook statistics, you can better understand the landscape of Facebook advertising and make informed decisions about your ad strategy.
Remember, the best approach to Facebook advertising is to constantly test and refine your Facebook ad campaigns based on data and insights.
As the platform continues to evolve, try to stay on top of industry trends and adjust your tactics accordingly.
With a little effort and the right Facebook ads tools, you can see significant improvements in your ad performance and drive more success for your business!
