Most PE-backed companies treat customer acquisition cost as a marketing problem. It is actually a balance sheet problem. At a median EBITDA purchase multiple of 11.8x in 2025, every dollar you remove from your annual marketing spend through efficiency gains does not stay in the marketing budget. It flows to EBITDA. And every dollar of EBITDA flows to enterprise value at exit, multiplied by your exit multiple.
This post runs the math. It is short because the framework is not complicated.
The reason most portfolio companies miss this value creation lever is not that the calculation is hard. It is that the marketing function has never been required to report in EBITDA terms.
The Mechanics: How CAC Reduction Reaches EBITDA
Sales and marketing expenses sit above the EBITDA line. For PE-backed B2B companies, S&M as a percentage of revenue typically runs between 28% and 45%, depending on growth stage and ARR size.
The marketing portion of that budget, roughly 35% to 45% of total S&M at the $20M to $100M revenue range, is where CAC improvement happens.
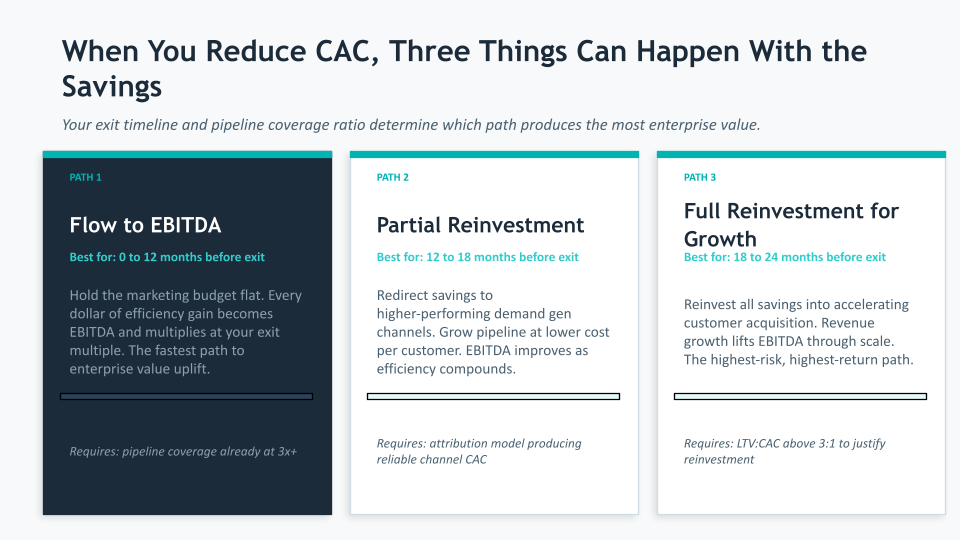
When you reduce CAC, one of three things happens with the savings:
- They flow directly to EBITDA if the budget is held flat (pure efficiency gain)
- They are partially reinvested into demand generation to grow the pipeline at the same CAC (growth-neutral efficiency gain)
- They are fully reinvested to accelerate revenue growth at a lower cost per customer (growth-accretive reinvestment)
For pre-exit companies with a defined exit horizon of 12 to 24 months, the first path produces the most immediate enterprise value. The second path is appropriate when pipeline coverage is below 3x, and growth is the priority. The right choice depends on where the portfolio company sits in its value creation timeline.
The Worked Math
The following is a composite illustration. No figures correspond to any specific named engagement.
| Variable | Baseline | After 30% CAC Reduction |
| Annual revenue | $45M | $45M |
| Total marketing budget | $5.4M (12% of revenue) | $5.4M (held flat) |
| CAC improvement | Baseline | 30% more efficient per dollar |
| Effective annual marketing savings | $0 | $1.62M |
| EBITDA (before improvement) | $7.2M (16% margin) | $7.2M |
| EBITDA (after, savings flow through) | $7.2M | $8.82M (+22.5%) |
| Enterprise value at 10x multiple | $72M | $88.2M |
| Enterprise value uplift | +$16.2M |
The $16.2M uplift in this illustration comes entirely from operating the same marketing budget more efficiently. No new headcount. No additional spend.
The lever is reallocation from underperforming channels to channels with documented lower cost per acquired customer, which requires three things: a functioning attribution model, at least two quarters of clean CAC data by channel, and a defined reallocation decision process.
The Multiplier Scales With Exit Multiple
Higher-quality assets command higher exit multiples. McKinsey notes that A-grade assets exit at 1.6x EBITDA turns above held values in the current environment. A company that improves its unit economics, reduces CAC payback below 12 months, and demonstrates a 3:1 or better LTV:CAC ratio enters the exit process as a higher-quality asset.
The table below shows how the same $1.62M EBITDA improvement compounds at different multiples:
| Exit Multiple | EBITDA Improvement | Enterprise Value Uplift |
| 8x | +$1.62M | +$12.96M |
| 10x | +$1.62M | +$16.2M |
| 12x (strong unit economics premium) | +$1.62M | +$19.44M |
The 12x scenario is not hypothetical. McKinsey’s research on marketing ROI finds that 15 to 20% of marketing spend is recoverable through better measurement and reallocation discipline.
Companies that document this improvement across 4 or more quarters build the track record that earns a premium multiple at exit. Buyers pay for evidence of a repeatable, capital-efficient growth engine. CAC trend data is one of the clearest forms of that evidence.
What This Requires Before You Can Run the Math
CAC reduction does not happen at the spreadsheet level. The savings in the table above require:
- A multi-touch attribution model that connects marketing spend to closed revenue by channel (takes 3 to 6 months to produce reliable data)
- Consistent CAC calculation methodology agreed on by marketing and finance (most portfolio companies have 3 different CAC figures depending on who you ask)
- Channel-level performance data showing cost per acquired customer over at least 6 months, not just cost per lead
- A documented reallocation decision process so budget moves can be justified in a board meeting and a CDD data room
For the full framework covering attribution infrastructure, LTV:CAC optimization, and the 24-month pre-exit marketing timeline, read the pillar post: How PE Firms Maximize Portfolio Valuation Through Marketing in the 24 Months Before Exit.
Azarian Growth Agency
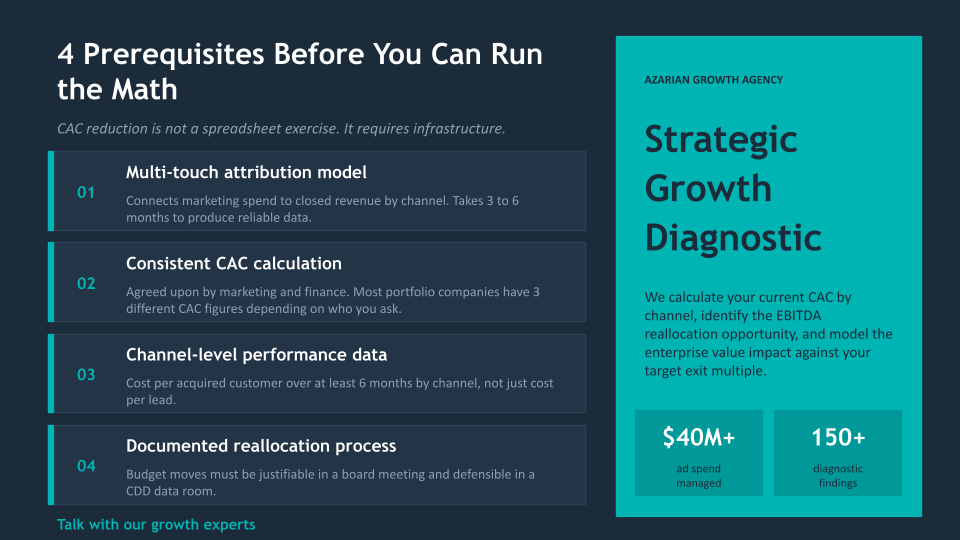
If you are preparing a portfolio company for exit in the next 12 to 24 months and the marketing budget has never been analyzed in EBITDA terms, our Strategic Growth Diagnostic builds that analysis.
We calculate your current blended CAC and CAC by channel, identify the reallocation opportunity, model the EBITDA and enterprise value impact against your target exit multiple, and produce a prioritized roadmap with the work sequenced for the pre-exit window.
The diagnostic runs 4 to 8 weeks. The output is a system-deep assessment of 150 or more prioritized findings organized by EBITDA impact.
Talk with our growth experts to understand what a pre-exit marketing assessment would uncover for your portfolio company.