
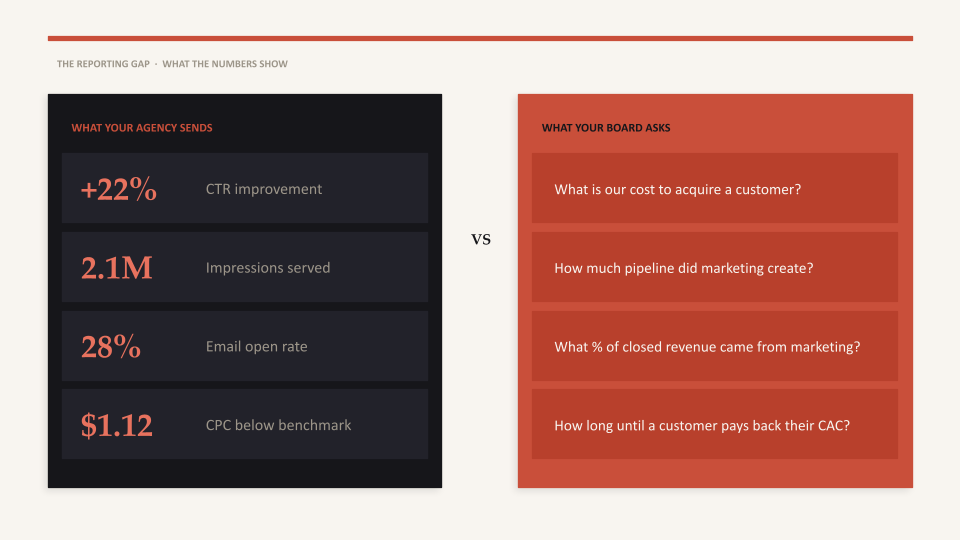
Your Google Ads agency sent you a report. CTR was up 22%. Impressions grew 18%. The email campaign hit a 31% open rate. Cost per click came in below the benchmark.
You have a board meeting in two weeks. Your investors will ask you three questions: What did marketing contribute to revenue this quarter? What is the current cost to acquire a customer? What does the pipeline look like for next quarter?
You cannot answer any of those questions from the agency report.
This is the reporting gap. It exists in the majority of PE-backed portfolio companies spending $500,000 or more on marketing annually. The agencies executing your programs are reporting on the metrics they can control. Your board is evaluating the metrics that determine your valuation. Nobody is connecting them.
The problem is structural, and it is getting worse. Gartner research found that only 52% of senior marketing leaders can prove marketing’s value and receive credit for its contribution to business outcomes. If barely half of professional marketing leaders can make this connection, a CEO operating without a dedicated CMO has almost no chance of building that bridge independently.
This article gives you the framework to close that gap: how to understand what agencies are actually reporting, what your board actually needs to see, and how to translate between the two with a practical reporting structure you can implement immediately.
Why Agency Reports Do Not Speak Board Language
Agencies report on the metrics they produce. This is not incompetence. It is the natural output of how agency contracts are structured. You paid them to run campaigns, manage media, create content, and optimize spend. They report that the campaigns ran, the media performed, the content was created, and the spend was optimized.
The problem is that these are activity and output metrics, not outcome or business impact metrics. They describe what happened inside the agency’s work. They do not describe what happened inside your business.
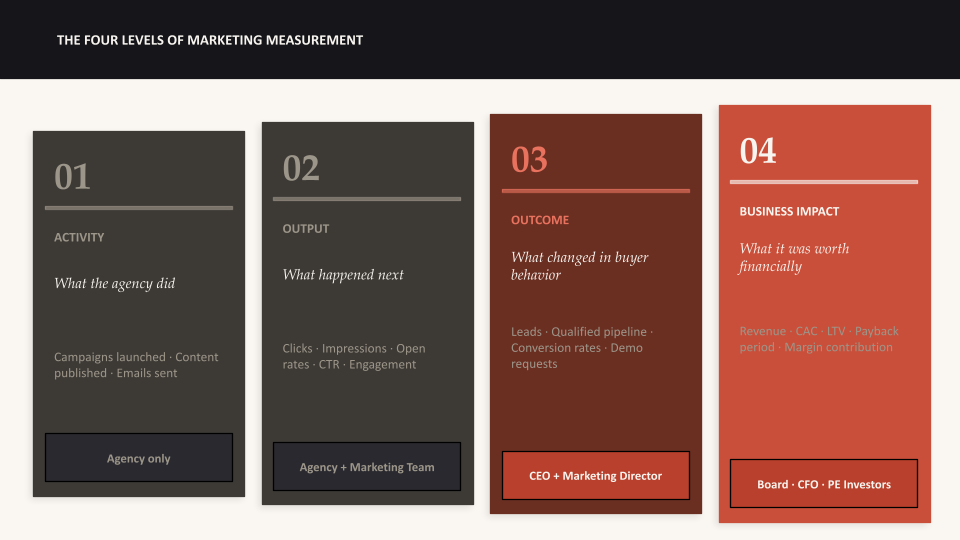
There are four levels of marketing measurement, and most agency reports only cover the first two:
| Level | What It Measures | Examples | Who Cares |
| 1. Activity | What the agency did | Campaigns launched, emails sent, content published | Agency |
| 2. Output | What happened next | Clicks, impressions, open rates, CTR, engagement | Agency, Marketing Team |
| 3. Outcome | What changed in buyer behavior | Leads, qualified pipeline, conversion rates, demo requests | CEO, Marketing Director |
| 4. Business Impact | What it was worth financially | Revenue, CAC, LTV, payback period, margin contribution | Board, CFO, PE Investors |
Most agency reports live at levels 1 and 2. Most board conversations start at level 4. The gap between those two planes is where marketing budgets get cut, CMOs get replaced, and PE relationships deteriorate.
This is not a minor communications problem. Marketing budgets have fallen to 7.7% of company revenue, down from 11% before 2020, a real decline of nearly 30%. When budgets compress under board scrutiny, the departments that cannot prove financial contribution are the first to be cut. Marketing is losing that argument because the reporting does not make the connection.
The CTR Problem
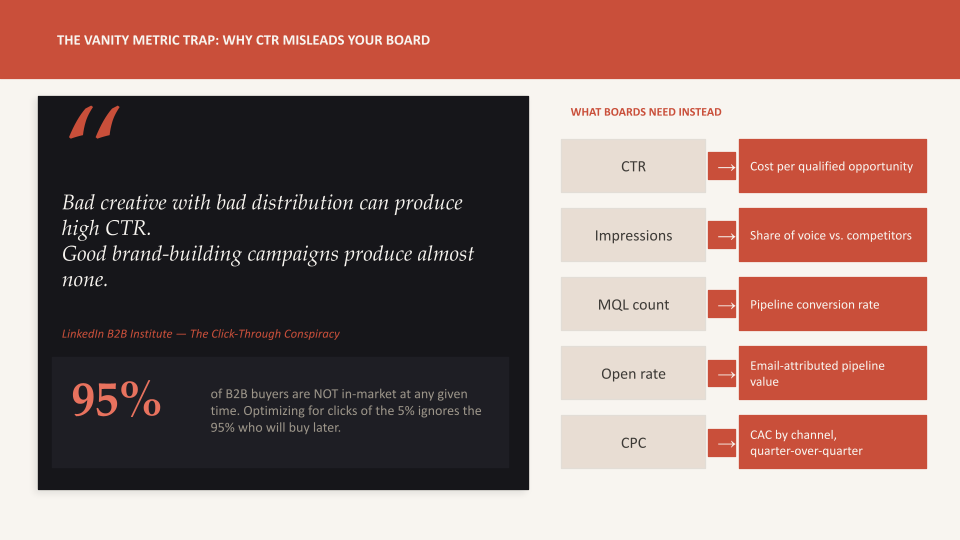
The LinkedIn B2B Institute published research with a pointed title: “The Click-Through Conspiracy.” The central finding: CTR is not just a weak predictor of business outcomes. It may be actively misleading. Bad creative with bad distribution can produce high CTR through clickbait mechanics, while strong brand-building campaigns that grow market share produce almost none.
95% of B2B buyers are not in market at any given time. B2B buyers change vendors approximately every five years, meaning only 5% are actively evaluating in any given quarter. Optimizing for the clicks of that 5% while ignoring the 95% who will be in market eventually is precisely the short-term trap that agency CTR reporting incentivizes.
When your agency reports that CTR improved 22%, they are not lying. That number is real. But Forrester research on B2B marketing measurement found that the metrics dominating most marketing dashboards, including CTR, engagement rates, and even marketing-sourced pipeline percentages, show no correlation with win rates, deal sizes, or revenue growth. They measure what is easy to measure, not what matters.
What Your Board Actually Asks in a Quarterly Review
PE boards are not marketing people. They are operators and investors who evaluate businesses through financial models, competitive dynamics, and unit economics. They have seen dozens of portfolio companies, and they know what healthy marketing looks like in financial terms.
Here are the questions that surface in nearly every quarterly board review for a PE-backed portfolio company with $20 million to $200 million in revenue:
- What is our current cost to acquire a customer, by channel?
- What is the ratio of marketing-generated pipeline to the quota we need to close?
- What percentage of closed revenue in the last quarter was touched by marketing?
- How long does it take for a new customer to pay back their acquisition cost?
- What is the trend in CAC over the last four quarters? Is it rising or falling?
- If we increase marketing spend by $500,000 next quarter, what additional pipeline should we expect?
None of these questions can be answered from a standard agency report. They require connecting the agency’s output to your CRM data, your revenue, and your financial model.
This matters for the board’s valuation calculation. Bain’s research consistently shows that revenue growth now accounts for more than half of total value creation in PE deals. Marketing that cannot demonstrate its contribution to revenue growth is not just a reporting problem. It is a valuation problem.
The CFO Trust Gap
The CFO relationship is where the reporting gap does its most damage. Only 48% of CFOs believe marketing is essential to corporate performance. That number reflects not a fundamental disagreement about whether marketing matters, but a structural failure to show CFOs the evidence they need to believe it.
A Deloitte global executive survey of more than 1,000 C-suite leaders found that 79% of the highest-growth companies reported C-suite alignment on marketing metrics, versus only 55% of lower-growth companies. The correlation is not coincidental. Companies where marketing and finance share a common measurement language grow faster because budget decisions are made on evidence, not persuasion.
The CMO Survey 2025, conducted by Duke and Deloitte, found that 64% of marketing leaders cite demonstrating the financial impact of marketing actions as their number one challenge. Pressure from CEOs, CFOs, and boards on this issue grew significantly between 2023 and 2025. The pressure is real and accelerating.
The Translation Framework: Activity to Business Impact
Closing the reporting gap requires a translation layer between what agencies produce and what boards consume. This is not about asking agencies to do more work. It is about building a structured connection between their outputs and your financial model.
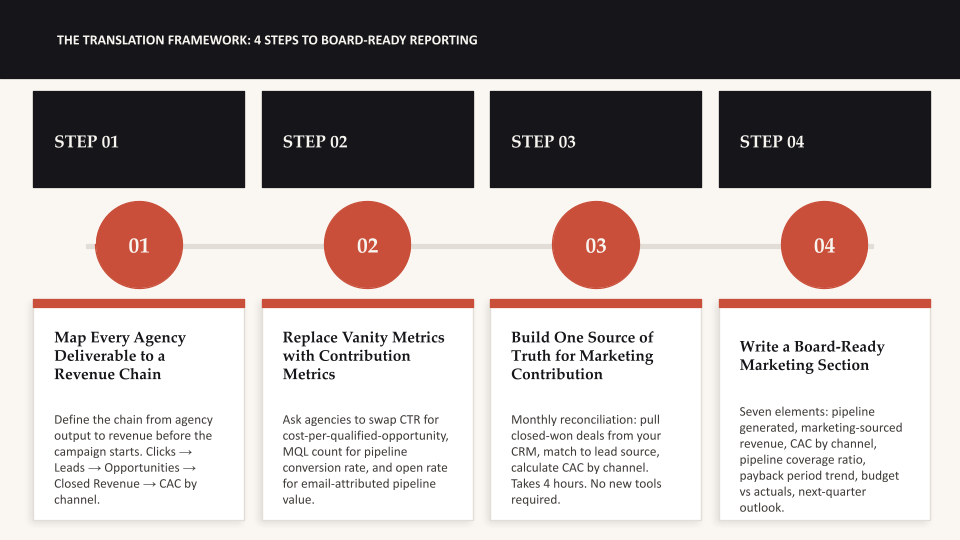
The framework has four steps:
Step 1: Map Every Agency Deliverable to a Revenue Chain
For every program your agency manages, define the chain from their output to your revenue. This chain should be documented and agreed upon before the agency starts work, not built retroactively when the board asks a question.
Example chain for a paid search program:
- Agency output: Paid clicks from Google Ads
- Your CRM records: Leads created from paid search source
- Sales outcome: Leads that became qualified opportunities
- Revenue outcome: Opportunities that closed
- Financial impact: Revenue generated, divided by total paid spend equals paid search CAC
When you have this chain mapped, the agency report becomes the first link in a longer analysis, not the final word. The agency tells you the clicks. You tell the board what those clicks became.
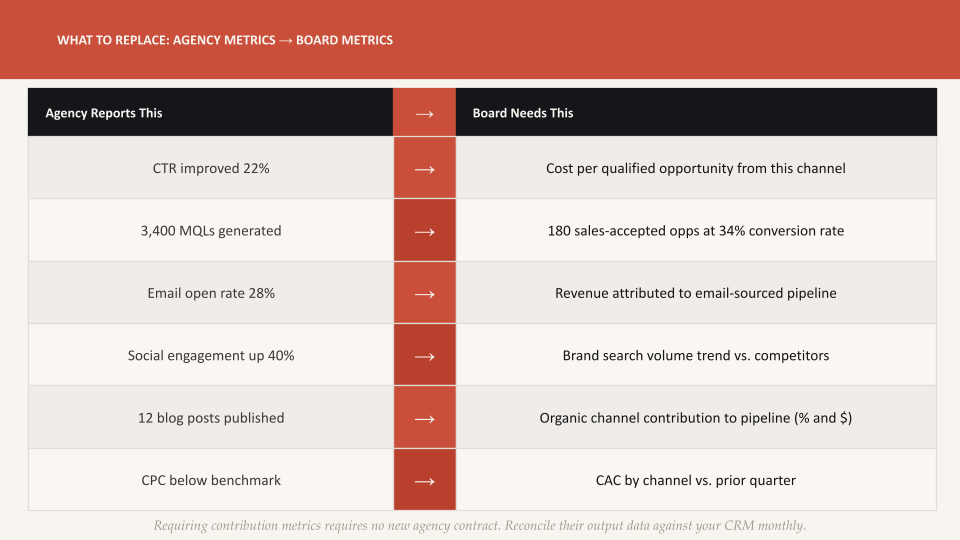
Step 2: Replace Vanity Metrics with Contribution Metrics
Ask your agencies to replace their standard activity and output metrics with contribution-focused alternatives. This requires a brief conversation and a revised reporting template, not a new agency.
| Agency Currently Reports | Replace or Supplement With | Why It Matters to the Board |
| CTR improved 22% | Cost per qualified opportunity from this channel | Board cares about efficiency, not clicks |
| 3,400 MQLs generated | 180 sales-accepted opportunities, 34% conversion rate | MQL volume is meaningless without conversion data |
| Email open rate 28% | Revenue-attributed to email-sourced pipeline | Open rates do not appear on an income statement |
| Social engagement up 40% | Brand search volume trend (proxy for awareness) | Engagement does not predict purchase intent |
| Campaign reached 2.1M impressions | Share of voice vs. top 3 competitors | Reach without context is not a business metric |
| 12 blog posts published | Organic channel contribution to pipeline (% and dollars) | Content volume is an activity, not an outcome |
| CPC below benchmark | CAC by channel vs. prior quarter | Board asks about CAC, not CPC |
Step 3: Build One Source of Truth for Marketing Contribution
The core problem in most PE-backed portfolio companies is that marketing data and revenue data live in separate systems. The agency has ad platform data. The marketing team has CRM data. Finance has revenue data. Nobody has connected them.
The solution is not a complex attribution model or a new technology platform. It is a monthly reconciliation exercise that takes approximately four hours with a CRM administrator and a spreadsheet:
- Pull all closed-won deals from the past quarter from your CRM
- For each deal, record the original lead source (paid search, organic, email, event, referral, direct)
- Sum the total marketing spend for each source category for the same period
- Calculate marketing-attributed revenue and cost per acquired customer by source
- Identify which channels are producing the lowest CAC and the highest win rates
This four-hour exercise produces the marketing contribution data your board needs, and your agency cannot provide. It requires no new tools. It requires access to two systems: your ad spend data and your CRM.
Step 4: Write a Board-Ready Marketing Section
Board reports follow a specific format that differs from agency reports. CFO University guidance on board reporting principles emphasizes: lead with what changed and why, provide variance analysis against plan, limit the section to 15 to 20 KPIs maximum, and include forward-looking guidance, not just historical reporting. Nothing annoys a board more than data points that change definition between meetings.
A board-ready marketing section for a PE-backed portfolio company covers seven elements and fits on two pages:
- Pipeline generated this quarter (opportunity count and dollar value vs. target)
- Marketing-sourced revenue (percentage of closed revenue with marketing touchpoints)
- Cost per acquired customer by channel vs. prior quarter trend
- Pipeline coverage ratio (current pipeline vs. next quarter quota)
- CAC payback period trend (months, by customer segment)
- Channel performance summary (which sources are improving, which are deteriorating)
- Budget vs. actuals with variance explanation
This structure gives the board what they need to evaluate marketing as a business investment, not as a cost center activity. It answers the CAC question, the pipeline question, and the budget efficiency question before they are asked.
How to Brief Agencies on Board-Ready Reporting
Most agencies are not withholding outcome data deliberately. They are reporting what their contracts require them to report. Changing the reporting output requires changing the brief.
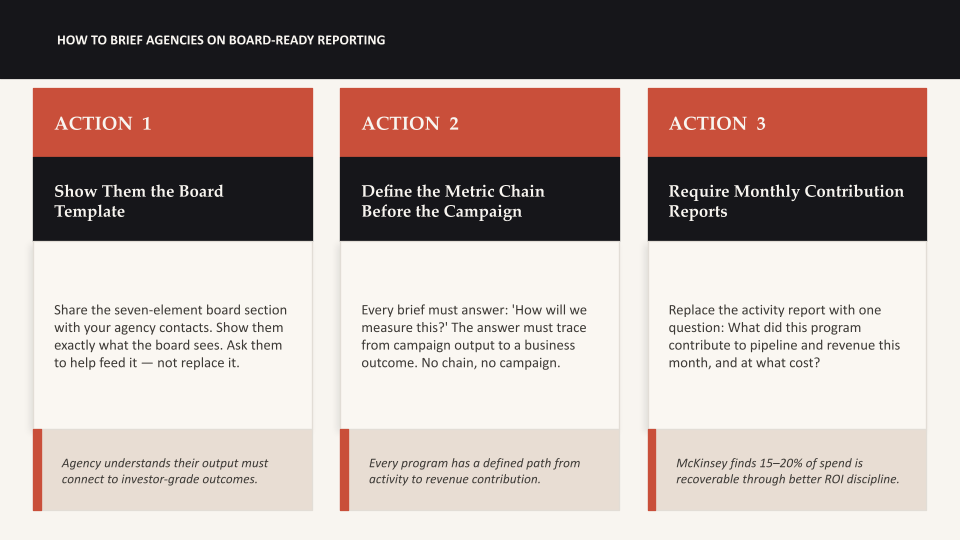
Show Them the Board Template
Share the seven-element board structure above with your primary agency contacts. Tell them you need their channel data to feed into that structure, not to replace it. Most agencies will understand immediately. They have probably had this conversation with other clients who went through a PE relationship change or a board scrutiny moment.
Define the Metric Chain Before the Campaign Starts
When briefing a new campaign, add one section to your brief: “How will we measure this?” The answer must trace from the campaign output to a business outcome. If the agency cannot describe that chain for the program they are proposing, the program is not ready to run.
Require Monthly Contribution Reports
Replace the monthly activity report with a monthly contribution report. The format is simple: which of our business outcomes did this program contribute to this month, by how much, and at what cost? McKinsey research on marketing ROI identifies that 15 to 20% of marketing spend is recoverable through better return-on-investment discipline. A contribution report is the mechanism that identifies where that recovery is available.
Set Outcome-Based Agency KPIs
Replace or supplement your agency contracts with outcome-oriented key performance indicators. This does not mean holding the agency accountable for revenue, which depends on factors outside their control. It means holding them accountable for the outcomes within their control that connect to revenue:
- Cost per qualified opportunity from their channel (not cost per lead)
- Pipeline velocity for their sourced leads (time from first touch to qualified opportunity)
- Marketing-to-sales conversion rate for leads they generate (not just lead volume)
- CAC trend for their channel (must move toward improvement over time, not stay flat)
Gartner found that organizations implementing comprehensive marketing contribution models see 37% higher marketing ROI than those that do not. The contribution model is not just a reporting exercise. It is a resource allocation tool that improves where spend goes and by how much.
The Board-Ready Marketing Report Template
The following template can be used as the marketing section of your quarterly board report. It covers the seven elements described above in the format boards expect.
MARKETING SECTION: BOARD REPORT TEMPLATE
Quarter ending [date] | Prepared by [name] | Company: [name]
1. Pipeline Generation (vs. Target)
Opportunities created by marketing: [number] ([target] target, [variance]% above/below)
Total pipeline value created: $[amount] ([target] target)
Primary source breakdown: Paid Search $[X] | Organic $[X] | Email $[X] | Events $[X]
2. Marketing Contribution to Closed Revenue
Closed revenue with marketing touchpoints this quarter: $[amount] ([%] of total closed revenue)
Prior quarter comparison: $[amount] ([%] of total), [+/-]% change
3. Customer Acquisition Cost by Channel
Blended CAC this quarter: $[amount] (prior quarter: $[amount], [+/-]% change)
CAC by channel: Paid Search $[X] | Organic $[X] | Email $[X] | Events $[X]
Highest-performing channel by CAC: [channel]
4. Pipeline Coverage Ratio
Current pipeline for next quarter: $[amount]
Quota for next quarter: $[amount]
Coverage ratio: [X]x (target: 3x minimum)
5. CAC Payback Period
Average months to payback: [number] (prior quarter: [number])
Trend: [improving / flat / deteriorating]
6. Budget vs. Actuals
Total marketing spend: $[amount] (budget: $[amount], [+/-]% variance)
Variance explanation: [one to two sentences]
Recommended adjustment for next quarter: [one sentence]
7. Next Quarter Outlook
Expected pipeline contribution from current programs: $[amount]
Programs in test/ramp that may contribute: [list]
Key risk: [one sentence on what could change the outlook]
About Azarian Growth Agency
Azarian Growth Agency helps PE-backed portfolio companies figure out why their marketing is not converting to revenue, then fixes it.
The reporting gap described in this article is one of the most consistent findings in our Strategic Growth Diagnostic work. When we go system-deep into a portfolio company’s marketing stack, we almost always find the same pattern: agencies reporting clicks and impressions, boards asking about CAC and pipeline, and no one in the middle connecting the two. The result is that marketing budgets survive on trust rather than evidence, which is an unstable position in any PE relationship.
Our Strategic Growth Diagnostic is a four-to-eight-week, system-deep assessment of how your marketing infrastructure is performing against your business objectives. We look at attribution chains, agency accountability structures, CRM data integrity, unit economics by channel, and the full gap between what your agencies report and what your board needs to see. The output is a prioritized roadmap of 150 to 200 findings, organized by dollar impact and implementation complexity.
One of the most common findings in that diagnostic is exactly what this article describes: a portfolio company spending $1 million or more annually on marketing agencies, receiving monthly reports full of activity metrics, and heading into quarterly board meetings without a clear answer to any of the questions that determine whether that budget continues or contracts.
We build the translation layer. We connect agency outputs to business outcomes, build the reporting structure that answers board questions before they are asked, and restructure agency accountability around the metrics that actually matter to investors. After the diagnostic, companies that choose to move into a Fractional CMO engagement have a validated roadmap from day one.
Azarian Growth Agency has managed over $40 million in advertising spend and supported companies that have raised over $300 million in funding. Our diagnostic methodology is validated across PE-backed engagements in financial services, insurance, fintech, healthcare, and B2B SaaS.
If your marketing agencies are sending you reports you cannot take into your next board meeting, that is not a communications problem. It is a structural problem with a specific solution.
Let’s talk.
Reach our growth experts or learn more about our Strategic Growth Diagnostic to understand what a system-deep assessment of your marketing reporting infrastructure would uncover.