
I was on a call with a CFO at a PE-backed consumer services company when he said something I have heard dozens of times: “Marketing sends me a report every month. I read it. I do not understand what any of it means for the business.”
He was not being dismissive. He was being honest. The report had open rates, click-through rates, cost per lead, impressions, and ROAS. Every metric was trending in the right direction. And the CFO still could not answer the question the board was asking: is marketing making us money, and how much?
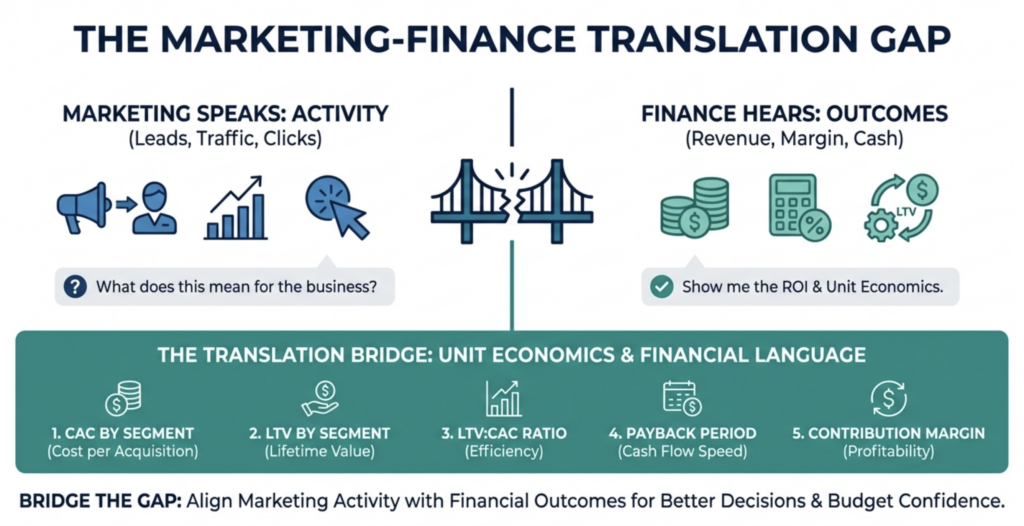
This is not a failure of reporting. This is a failure of translation.
Marketing and finance use different languages, different time horizons, and different definitions of what matters. Marketing measures activity: leads generated, traffic driven, campaigns launched. Finance measures outcomes: revenue produced, margin earned, cash returned. The two scorecards overlap almost nowhere.
McKinsey published research in 2025 showing that 70% of CEOs measure marketing based on year-over-year revenue growth and margin. But only 35% of CMOs track the same metric as a top priority. CEO-CMO misalignment has increased 20% since 2023.
The problem gets worse when you add the CFO to the picture. Research from the CMO Council and KPMG found that only 22% of CMO-CFO partnerships are truly collaborative. Over a quarter of CMOs describe the relationship with finance as “indifferent,” and 7% call it “hesitant.”
And a 2025 study from Marketing Dive and Perion found that only 22% of marketers strongly feel they have enough data to justify their value to the CFO.
That is two different data points, from two different studies, landing on the same number: 22%. One in five. That is how many marketing leaders feel confident they can speak finance’s language.
This article is a practical guide to closing that gap. It covers the specific terminology that creates confusion, the unit economics that CFOs actually care about, and a framework for building marketing reports that finance will read, trust, and fund.
Why the Translation Gap Causes Real Decision-Making Failures
The marketing-finance disconnect is not just a communication problem. It produces concrete financial harm.
According to BCG, strong CMO-CFO relationships can deliver 20% to 40% improvements in marketing spending efficiency. That means the gap between aligned and misaligned marketing-finance partnerships is not a rounding error. It is a material difference in how much revenue each marketing dollar produces.
Here is how the translation failure plays out in practice:
Budget decisions based on the wrong metrics. When marketing reports ROAS and finance thinks in contribution margin, budget conversations become arguments about definitions instead of decisions about allocation.
The Deloitte CFO Survey 2024 found that 78% of financial executives now expect detailed ROI evidence for marketing. If marketing cannot produce that evidence in financial terms, the default response from finance is to cut.
Profitable channels getting killed. At one consumer services company we assessed, the finance team recommended cutting the paid social budget because the reported ROAS was 1.8x, below the 3x threshold they used for investment decisions. When we recalculated using customer lifetime value instead of first-purchase revenue, the true return was 5.2x over 18 months.
The channel was the most profitable acquisition source in the portfolio. It almost got killed because the two teams were using different math.
Unprofitable segments getting funded. Blended metrics hide segment-level losses. We regularly find that unit economics vary by 300% to 500% across customer segments.
When marketing reports a single average CAC, the CFO has no way to see that one segment is generating positive contribution while another is losing money on every acquisition.
Board confidence eroding. The CMO Survey reports that board pressure on marketing rose 21% between 2023 and 2025, and CFO pressure rose 52%. That pressure is a direct result of the translation gap. When the board asks, “What did we get for the money?” and marketing answers in a language the board does not speak, trust declines.
IBM’s 2025 CMO Study found that 64% of CMOs are now held accountable for company profitability. But most marketing teams still report in activity metrics that cannot be connected to a P&L. The accountability has shifted. The reporting has not.
The Translation Table: What Marketing Says vs. What Finance Hears
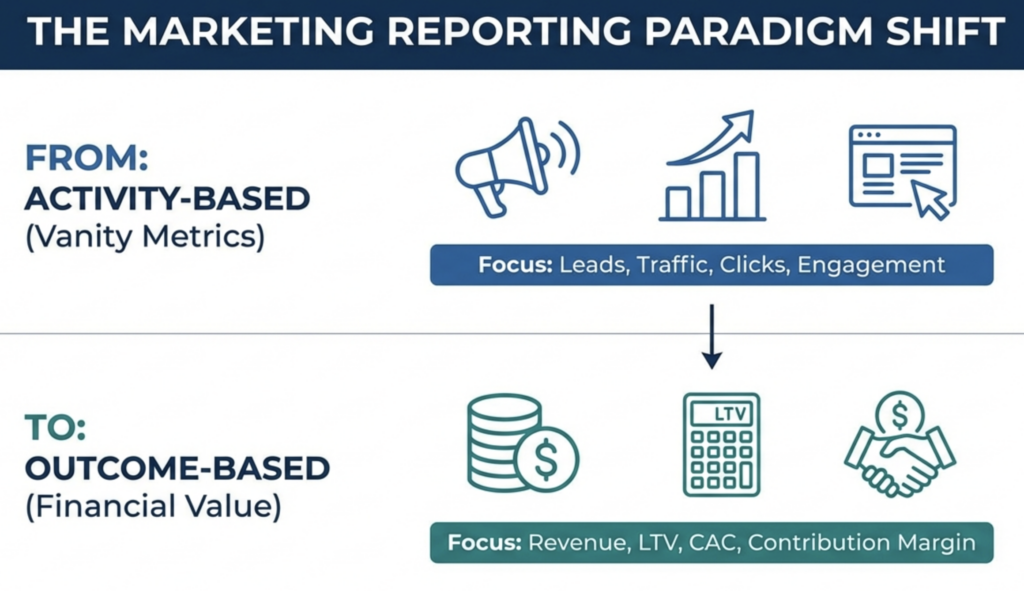
The core of the marketing-finance disconnect is vocabulary. Marketing uses terms that describe activity. Finance uses terms that describe outcomes. When marketing presents results in its own language, finance hears something different from what was intended.
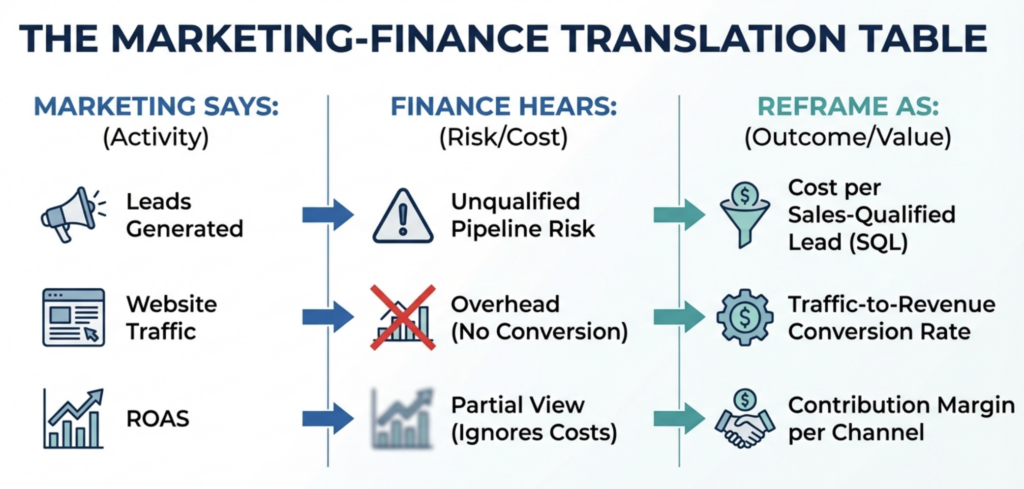
Here is a side-by-side reference of common marketing terms, what finance actually hears when those terms are used, and how to reframe them in financial language.
| Marketing Says | Finance Hears | Reframe As | Why It Matters |
| Impressions | Vanity metric | Cost per qualified impression | Ties visibility to spend efficiency |
| Leads generated | Unqualified pipeline risk | Cost per sales-qualified lead | Shows quality, not just volume |
| Website traffic | Overhead with no conversion data | Traffic-to-customer conversion rate | Connects traffic to revenue |
| ROAS | Partial view of return | Contribution margin per channel | Accounts for the full cost structure |
| Click-through rate | Activity metric | Cost per engaged prospect | Shows the efficiency of spend |
| Open rate | Unreliable metric | Revenue per email subscriber | Ties the email to the financial outcome |
| Brand awareness | Unquantifiable expense | Brand-attributed pipeline lift | Connects brand to measurable demand |
| MQLs | Marketing’s self-graded homework | MQL-to-revenue conversion rate | Shows actual funnel efficiency |
| Engagement rate | Soft metric | Engagement-to-pipeline correlation | Proves engagement drives revenue |
| Cost per lead | Acquisition cost without quality | CAC by channel and segment | Shows the true cost to acquire a customer |
This table is the foundation. Print it. Share it with your finance team. Use it to rewrite every marketing report your company produces. The goal is not to stop measuring activity metrics. The goal is to connect them to outcomes that finance can evaluate and fund.
As Google’s marketing team described in a 2025 Think with Google article, they made this exact shift: they stopped speaking “the language of clicks” and started speaking “the language of capital allocation.” The result was that finance stopped auditing their math and started co-authoring growth plans.
Five Unit Economics Metrics Every Marketing Team Should Track
Unit economics are the bridge between marketing activity and financial outcomes. They answer the question that every CFO, board member, and PE operating partner is asking: does each customer we acquire make us money, and how quickly?
Here are the five metrics that belong in every marketing report and how to calculate and present each one.
1. Customer Acquisition Cost (CAC) by Channel and Segment
CAC measures the total cost to acquire one customer. This includes ad spend, agency fees, marketing team salaries, tools, and any other costs directly attributable to acquisition.
The formula: Total sales and marketing costs in a period divided by the number of new customers acquired in that period.
The critical detail: do not report a single blended CAC. Break it down by channel (paid search, paid social, organic, email, referral) and by customer segment. We regularly find that CAC varies by 300% to 500% across segments at the same company. A blended average hides the fact that some segments are profitable and others are losing money.
For context, industry benchmarks show that the average B2B SaaS CAC is approximately $700, while fintech companies average $1,450, and e-commerce averages $70. But these numbers are meaningless without your segment-level breakdown.
2. Customer Lifetime Value (LTV) by Segment
LTV measures the total revenue a customer generates over their entire relationship with your company, minus the direct costs of serving them.
The formula: Average revenue per customer per month, multiplied by average customer lifespan in months, multiplied by gross margin percentage.
LTV should also be segmented. At one SaaS company we assessed, enterprise customers had an LTV of $180,000. SMB customers had an LTV of $8,500. The company was spending the same acquisition budget on both segments. The unit economics were radically different, but the blended report made them look identical.
3. LTV-to-CAC Ratio
This is the single most important metric for evaluating marketing efficiency. It tells you how much revenue each acquisition dollar produces over the customer’s lifetime.
The benchmark: A healthy LTV-to-CAC ratio is 3:1 or higher, meaning each customer generates at least three times what it cost to acquire them. Best-in-class companies operate at 5:1 or above. Below 2:1, the business is likely losing money on acquisition after accounting for overhead and cost of capital.
This metric speaks the CFO’s language directly. It says: for every dollar we invest in acquiring customers, we get X dollars back. No translation needed.
4. CAC Payback Period
Payback period measures how many months it takes to recover the cost of acquiring a customer through the gross margin revenue that the customer generates.
The formula: CAC divided by (monthly revenue per customer multiplied by gross margin percentage).
This metric matters to CFOs because it is a direct measure of cash flow impact. A 6-month payback means you recover your investment twice a year. A 24-month payback means you are financing customer acquisition for two years before breaking even. That has real implications for working capital and growth capacity.
Current benchmarks: best-in-class B2B SaaS companies achieve payback under 12 months. The median across the industry is approximately 15 to 18 months. Anything above 24 months is a red flag for investors.
5. Contribution Margin per Customer Cohort
Contribution margin measures how much revenue a customer generates after subtracting the direct costs of acquiring and serving them. It is the metric that tells you whether each customer is actually profitable.
The formula: Revenue per customer minus CAC minus direct cost to serve, divided by revenue per customer. Express as a percentage.
This metric is the ultimate bridge between marketing and finance because it answers the question in the language the CFO already uses: what is our margin on each customer? Report it by cohort (the month or quarter the customer was acquired) so the CFO can see whether acquisition quality is improving or declining over time.
How to Build a Marketing Report That Finance Will Actually Read
Most marketing reports fail the CFO test for three reasons: they are too long, they lead with activity instead of outcomes, and they use terminology that requires translation. Here is a framework for building a report that finance will read, trust, and use to make budget decisions.
Lead with Outcomes, Not Activity
The first number on the report should be marketing-attributed revenue or pipeline contribution. Not leads. Not traffic. Not impressions. Revenue first, then work backward to explain how the revenue was generated.
Forrester’s research shows that companies consistently tracking revenue-oriented marketing metrics were able to increase their marketing budgets by an average of 17%. When finance sees the connection between marketing spend and revenue, the budget conversation changes from justification to allocation.
Structure Around Unit Economics
After revenue, present the five unit economics metrics: CAC by channel, LTV by segment, LTV-to-CAC ratio, payback period, and contribution margin. Show trend data (quarter over quarter at minimum) so the CFO can see direction, not just a snapshot.
Include variance analysis: how did actuals compare to forecast? What changed and why? This is the language of finance. If marketing can produce it, the CFO stops asking “what does this mean?” and starts asking “where should we invest more?”
One Page, No Jargon
Gartner’s 2025 data shows marketing budgets flat at 7.7% of company revenue, with 59% of CMOs reporting insufficient budget. If you want more budget, the report needs to be readable by the person who controls it. That means one page, financial terms, and clear connections between spend and outcome.
Remove MQLs, CTR, open rates, and engagement scores from the executive report. They belong in the operational dashboard that the marketing team uses internally. The CFO report should contain only metrics that connect to the P&L.
Build the Report Together
The most effective approach is co-creation. Sit down with the CFO or finance lead and ask: what metrics would make you confident that marketing is working? Then build the report to answer those specific questions. When marketing metrics are co-owned by finance, they gain credibility, and marketing gains budget.
The Structural Problem Behind the Translation Gap
The marketing-finance translation gap is not a communication preference. It is a structural failure.
In most growth-stage companies, nobody owns the connection between marketing activity and financial outcomes. The marketing team owns campaigns. The sales team owns the pipeline. Finance owns the P&L. The space between “leads generated” and “revenue produced” belongs to nobody.
This is the missing strategic layer. It is the function that builds the attribution infrastructure, calculates unit economics by segment, reconciles CRM data with financial data, and produces reporting that both marketing and finance can trust.
Without it, marketing reports in its own language. Finance interprets through its own lens. And the two versions of reality never align.
For a detailed breakdown of this structural disconnect and how to identify it in your organization, read our analysis of the strategic layer gap in PE-backed portfolio companies.
How Azarian Growth Agency Builds the Bridge
At Azarian Growth Agency, the marketing-to-finance translation gap is the exact problem we solve.
We run paid, independent Strategic Growth Diagnostics that go system-deep into attribution infrastructure, CRM configurations, unit economics, and vendor accountability. We identify where the translation is breaking down, which metrics are misleading, and how much revenue is being lost to measurement gaps.
At one consumer services company, our diagnostic found that the finance team was evaluating paid social using first-purchase ROAS of 1.8x, while the true return was 5.2x when measured on customer lifetime value.
The channel was about to be cut. We built a shared measurement framework, recalculated unit economics by segment, and showed the CFO that the channel was producing customers at a lower cost than any other source in the portfolio.
Every one of those findings was a translation problem. The data existed. The teams were working. But nobody had built the infrastructure to convert marketing activity into financial language.
If your marketing team is reporting strong metrics while the CFO keeps asking what it all means, the answer is not a better report. The answer is a diagnostic that identifies the measurement gaps and a strategic layer that speaks both languages.
See How the Strategic Growth Diagnostic Works
Sources and Further Reading
- McKinsey & Company, “The CMO’s Comeback: Aligning the C-Suite to Drive Customer-Centric Growth” (2025) https://www.mckinsey.com/capabilities/growth-marketing-and-sales/our-insights/the-cmos-comeback-aligning-the-c-suite-to-drive-customer-centric-growth
- CMO Council & KPMG, “Marketing & Finance: Fuelling Innovation or Falling Behind?” https://www.marketingweek.com/cmo-council-cfo-relationship/
- BCG, “CMOs and CFOs Working Together to Measure Success Effectively” (2020) https://www.bcg.com/publications/2020/cmos-and-cfos-working-together-to-measure-success-effectively
- Marketing Dive / Perion, “The CMO-CFO Relationship: Here’s What the Numbers Say” (2025) https://www.marketingdive.com/news/the-cmo-cfo-relationship-heres-what-the-numbers-say/806122/
- IBM, “2025 CMO Study: CMOs Now Held Accountable for Profitability” https://emfluence.com/blog/what-cmos-are-prioritizing-in-the-second-half-of-2025
- Gartner, “2025 CMO Spend Survey: Marketing Budgets Have Flatlined at 7.7% of Revenue” https://www.gartner.com/en/newsroom/press-releases/2025-05-12-gartner-2025-cmo-spend-survey-reveals-marketing-budgets-have-flatlined-at-seven-percent-of-overall-company-revenue
- Brixon Group / Deloitte CFO Survey & Forrester, “Dashboards That Really Matter: The CFO’s Perspective on Marketing KPIs” (2025) https://brixongroup.com/en/dashboards-that-really-matter-the-cfos-perspective-on-marketing-kpis-in/
- Google Think, “9 Steps for Marketing and Finance Alignment” (2025) https://business.google.com/en-all/think/measurement/marketing-and-finance-incrementality-measurement-strategy/
- CMO Survey, Spring 2025, “Board Pressure on Marketing Rose 21%; CFO Pressure Rose 52%” https://funnel.io/blog/roi-of-marketing
- Funnel.io, “How Marketing and Finance Can Break Down Data Silos for Faster Growth” (2025) https://funnel.io/blog/finance-in-marketing