“How much money did you leave on the table last quarter?”
It’s a tricky question, but for many businesses, the answer lies in one metric: their ROAS.
In a world where every marketing dollar counts, industry-specific ROAS benchmarks are the key to making smarter decisions and driving higher profits.
Businesses that leverage data-driven marketing strategies, such as ROAS optimization, see up to 20% revenue increases and 30% cost savings compared to those that don’t.
This is where tools like the ROAS Calculator, offered by leading marketing agencies, come in.
Partnering with an agency that provides tools to benchmark your performance can give you the insights you need to ensure that every dollar spent returns a multiplied return.
In this article, we’ll explore how to calculate ROAS, the differences between ROAS vs. ROI, and the industry-specific insights you need to stay ahead of the curve.
Let’s get started.
ROAS Made Simple: What It Means for Your Bottom Line
If you’re wondering whether your ad spend is pulling its weight, the answer lies in a straightforward calculation: ROAS (Return on Ad Spend).
Measuring how effectively your campaigns convert dollars into revenue is the ultimate metric.
Here’s the formula, no fluff:
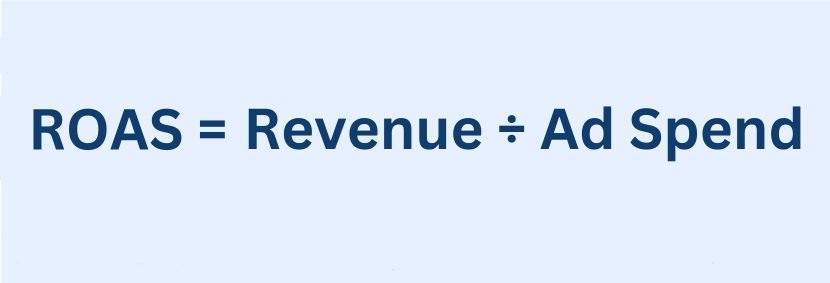
Let’s break it down with an example:
- You run a Google Ads campaign for your DTC skincare brand.
- You spend $1,000 on ads for your latest product launch, generating $4,000 in revenue.
- Your ROAS = $4,000 ÷ $1,000 = 4 (or 400%).
This means that for every $1 spent on advertising, you earned $4 in return.
Why ROAS Is Non-Negotiable for Business Owners
Unlike vanity metrics like impressions or clicks, ROAS gets straight to the point: Is your ad budget delivering profits, or are you burning money?
How to Calculate ROAS Without the Guesswork
Not a numbers person? Don’t worry. Many marketing agencies offer tools like a ROAS Calculator to help you do the math.
These calculators help you track campaign performance in real-time, making it easier to adjust your strategy before it’s too late.
What’s Considered “Good”? A Snapshot of Industry Standards
Regarding ROAS benchmarks by industry, no two sectors are the same.
What’s considered a success for an eCommerce company might be a red flag for a B2B SaaS firm.
Understanding industry-specific averages is critical for setting realistic goals and avoiding wasted ad spend.
Here’s a detailed snapshot of average ROAS performance across paid and organic channels:
Average ROAS by Channel
| Channel | Average ROAS |
| Paid Advertising | |
| PPC/SEM | 1.55 |
| Facebook Ads | 1.80 |
| LinkedIn Ads | 2.30 |
| Influencer Marketing | 3.45 |
| Organic Marketing | |
| SEO | 9.10 |
| Email Marketing | 3.50 |
| LinkedIn Organic | 2.75 |
| Webinars | 4.95 |
Industry-Specific ROAS for PPC and SEO
For a deeper dive, here’s how PPC (Paid Search) and SEO (Organic Search) perform across industries:
| Industry | PPC/SEM ROAS | SEO ROAS |
| Aerospace & Defense | 0.95 | 10.35 |
| Addiction Treatment | 1.65 | 8.90 |
| Automotive | 1.20 | 12.10 |
| B2B SaaS | 1.70 | 8.75 |
| E-commerce | 2.05 | 3.65 |
| Higher Education | 1.90 | 10.40 |
| Real Estate | 1.40 | 15.10 |
| Solar Energy | 1.25 | 9.20 |
What We See in Our Own Data
38%
of budget going to channels with 3x target CAC
34%
Within 90 days of spend reallocation
In a recent AGA Strategic Growth Diagnostic for a PE-backed financial services company ($50M+ revenue), channel-level CAC analysis revealed 38% of paid media spend was allocated to channels with 3x the target acquisition cost. Reallocation based on per-channel unit economics reduced overall CAC by 34% within 90 days — without increasing total ad budget.
Methodology Note:
4-week Strategic Growth Diagnostic measuring CAC by channel across Google Ads, Meta Ads, and offline channels. Spend reallocation prioritized channels with lowest CAC-to-LTV ratio. Results measured at 90 days post-reallocation.
Source: Azarian Growth Agency, Strategic Growth Diagnostic, 2024. PE-backed financial services, $1.2M annual marketing spend.
Insight: Why Do ROAS Benchmarks Differ So Much?
- Intent Matters:
- Industries like real estate or automotive tend to see higher SEO ROAS because search intent for big-ticket items is powerful. People who search for “best luxury car dealers” or “real estate listings in Miami” are already primed to buy, leading to better returns.
- Customer Journey Complexity:
- B2B SaaS and construction often have longer sales cycles, which results in lower PPC ROAS. However, a ROAS of 1.7 might still succeed in these cases because a customer’s lifetime value (LTV) far outweighs the acquisition cost.
- Paid vs. Organic Campaigns:
- Organic campaigns like SEO or email marketing deliver much higher ROAS over time because they rely less on continuous ad spending. For instance, SEO campaigns for the biotech sector averaged a ROAS of 9.20, nearly quadrupling the PPC performance for the same industry.
Pro Tip: Use Benchmarks as a Starting Point, Not the Final Word
Knowing ROAS benchmarks by industry helps you set expectations, but your unique circumstances matter, too. Ask yourself:
- What is your break-even ROAS? (Based on your profit margins.)
- Are you considering lifetime customer value (LTV) in your calculations?
- Are you tracking both paid and organic performance for a complete picture?
Break-Even ROAS: The One Metric You Can’t Afford to Miss
Imagine you’re running what seems like a successful ad campaign.
The clicks are rolling in, sales are happening, and the revenue looks excellent.
But here’s the kicker: you might still lose money if you don’t track your break-even ROAS.
What Is Break-Even ROAS?
Break-even ROAS is the bare minimum return your ad spend needs to generate to cover costs without losing money. It ensures your revenue looks good on paper and sustains your business.
The formula is simple:
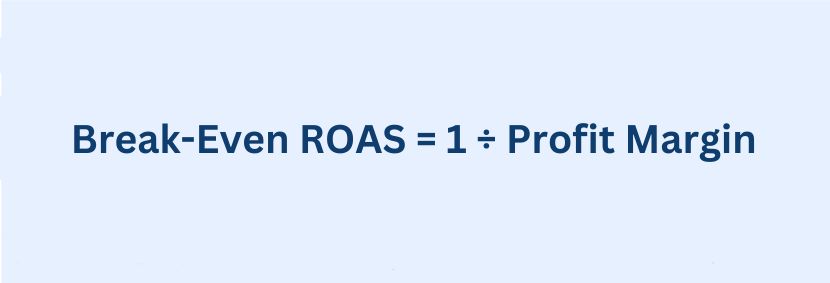
Here’s an example to make it clear:
- Let’s say your profit margin is 25%.
- Break-Even ROAS = 1 ÷ 0.25 = 4.
- For every $1 you spend on ads, you need at least $4 in revenue just to break even. Anything below a ROAS of 4 means you’re losing money.
Now, imagine you’re running an ad campaign with an ROAS of 3. On the surface, this might seem like a good result, but you’re eating into your profits without reaching the break-even point.
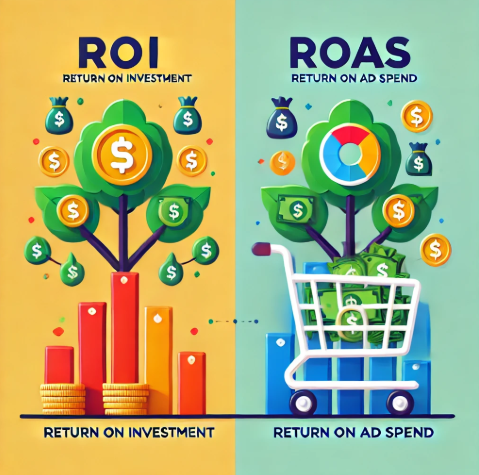
ROAS vs ROI: What’s the Difference?
While ROAS (Return on Ad Spend) measures the performance of individual ad campaigns, ROI (Return on Investment) takes a broader approach.
Created by DALL E
ROI factors in all costs, including overhead, product development, marketing support, and salaries.
Here’s a quick comparison:
| Metric | What It Measures | Formula |
| ROAS | Revenue generated per dollar of ad spend | Revenue ÷ Ad Spend |
| ROI | Total profit generated after accounting for all expenses | (Net Profit ÷ Total Investment) x 100% |
Example: ROAS vs ROI in Action
- Scenario 1: A DTC skincare brand spends $50,000 on PPC ads and generates $150,000 in revenue. Their ROAS is:
ROAS = $150,000 ÷ $50,000 = 3.
This looks great because the brand makes $3 for every $1 spent on ads. - However, their total campaign cost, including product costs, agency fees, and logistics, is $120,000. Now, the ROI calculation looks like this:
ROI = ($150,000 – $120,000) ÷ $120,000 x 100 = 25%.
The ROAS shows how well the ads performed, while the ROI reveals the true profitability of the entire effort.
Why Break-Even ROAS Is Crucial
You’re gambling with your profits if you’re scaling your ad campaigns without calculating your break-even ROAS. By understanding the difference between ROAS and ROI, you can:
- Ensure your ad spend is sustainable.
- Set clear goals for revenue generation.
- Avoid the trap of “profitable-looking” campaigns that lose money.
Significant Trends Shaping ROAS in Today’s Market
The advertising world is constantly evolving, and so are the ROAS benchmarks by industry.
Here are some of the biggest trends redefining ad performance and how businesses can leverage them to get the most out of their campaigns:
1. AI-Powered Ad Campaigns
- What’s New: Platforms like Google Performance Max and Meta Advantage harness AI to automate bidding, audience targeting, and creative optimization.
- Why It Matters:
- AI-driven campaigns analyze millions of data points in real-time to adjust ads for better performance.
- Actionable Insight: If you’re not using AI to manage campaigns, you’re leaving money on the table. Start exploring AI tools to boost your ad efficiency.
Source: Meta Advantage+
2. Platform-Specific ROAS Variability
- Facebook Ads: ROAS typically ranges from 200%-400%, with retargeting campaigns often outperforming cold audiences.
- Google Search Ads: High-intent audiences drive exceptional results, with ROAS benchmarks of 400% to 800% in some industries, such as travel and real estate.
- TikTok Ads: While benchmarks are lower (150%-300%), the platform delivers unmatched engagement with Gen Z and Millennial audiences, making it a valuable channel for brand-building.
- Why It Matters:
- Choosing the right platform can dramatically impact your campaign success.
- Different platforms cater to various stages of the customer journey—Google for intent, Facebook for retargeting, and TikTok for discovery.
- Actionable Insight: Diversify your ad spend across platforms, but prioritize channels that align with your audience behavior and industry benchmarks.
3. Creative Personalization
- What’s New: Personalized ad creatives, like dynamic product ads on Facebook and Google, outperform static ads by significant margins.
- Why It Matters:
- Today’s consumers expect tailored experiences. Ads that reflect their interests, behaviors, or even abandoned products in their cart drive higher conversions.
- Actionable Insight: Invest in tools that allow you to dynamically adapt ad creative based on user behavior and test personalized messaging to boost engagement.
4. The Rise of Video and Visual Content
- What’s New: Platforms like TikTok and Instagram prioritize short-form video content, and this format delivers excellent results.
- Why It Matters:
- Video ads hold attention longer and increase engagement rates, especially with younger audiences.
- Platforms like TikTok optimize video ads for native discovery, making them feel more authentic and less intrusive.
- Actionable Insight: Consider shifting part of your ad budget toward video production. Platforms favor this type of content, and consumers respond better to dynamic, visual storytelling.
5. Seasonality and High-Intent Timing
- What’s New: Advertisers are doubling down on seasonality, particularly in industries like eCommerce and travel.
- Why It Matters:
- Peak seasons (e.g., Black Friday or summer travel planning) drive ROAS well above annual averages.
- Timing campaigns to align with customer intent results in higher conversions and better ad efficiency.
- Actionable Insight: Use historical data to map seasonal trends in your industry and allocate more budget to campaigns during high-demand periods
How to Use Benchmarks to Drive Smarter Decisions
Understanding ROAS benchmarks by industry is just the first step. The real value comes from applying them to refine your ad strategy and make smarter decisions. Here’s how:
- Optimize Ad Creative: Use high-quality visuals and audience-specific messaging. Ads that speak directly to your audience’s needs can significantly boost engagement and conversion rates.
- Retarget Strategically: Focus on warm audiences already interacting with your brand. Retargeting campaigns consistently outperform cold outreach, pushing your ROAS beyond average levels.
- Test and Iterate: A/B tests everything, including ad copy, creative, targeting, and placements. Even small changes can significantly impact performance.
- Leverage AI: Use tools like Madgicx or Google Ads automation to analyze data, uncover optimization opportunities, and improve ROAS efficiency.
Making ROAS Work for Your Business with [A] Growth Agency
Understanding ROAS benchmarks by industry is all about using data to drive smarter decisions and unlock your business’s full potential.
By benchmarking your ad performance, calculating your break-even ROAS, and leveraging industry insights, you can allocate your ad spend more strategically and maximize your profits.
At [A] Growth Agency, we believe that ROAS is a compass guiding you toward profitability.
That’s why we provide tools like our ROAS Calculator, which helps you accurately measure campaign performance and compare it to industry standards.
With our expertise in data-driven marketing and access to cutting-edge tools, we’ll help you optimize every dollar spent, ensuring your campaigns work harder and deliver greater returns.
Remember, ROAS is the foundation for scalable, sustainable growth.
Understand it, optimize it, and use it to outpace your competition. Ready to take your business to the next level?
Let’s make it happen with [A] Growth Agency.