
Last year, we ran a diagnostic on a financial services portfolio company spending over $12 million annually on marketing. They had a 4-person team, three external agencies, active campaigns on Google, Meta, and LinkedIn, and revenue had been flat for more than a year.
Within the first 30 minutes of accessing their CRM, we found that roughly 60% of paid leads were entering a dead queue and never receiving a single follow-up email.
A field default set to “Unqualified” instead of “Lead” during a platform migration was silently putting nearly $12 million in the pipeline at risk. Nobody on the marketing team, none of the agencies, and not even the CFO knew it was happening.
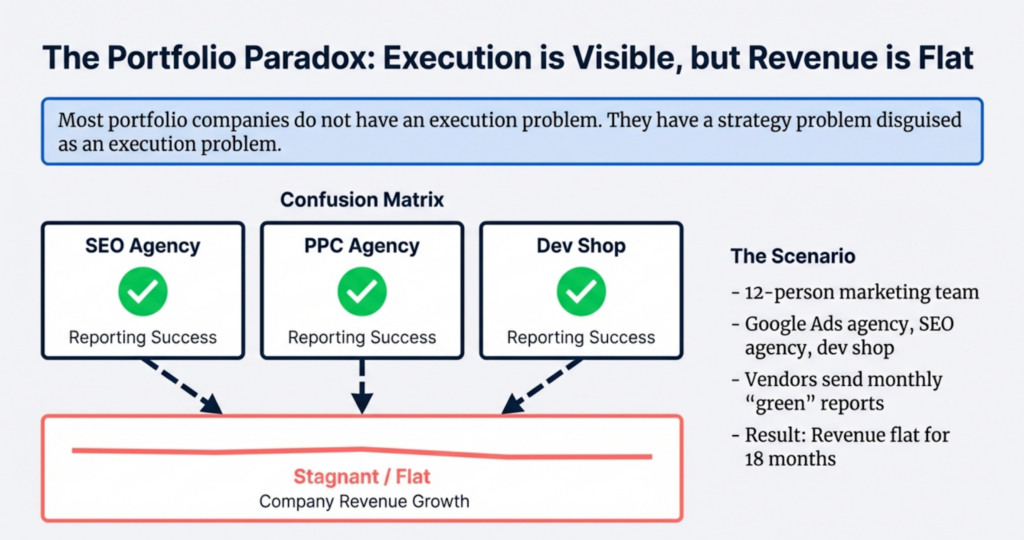
That company is not unusual. It is a pattern we see repeatedly at PE-backed companies between $20M and $200M in revenue. The marketing infrastructure looks complete from the outside. The spending is there. The people are there. The vendors are there. But revenue does not move.
This article explains why that happens, what the root cause actually is, and what fixing it looks like in practice.
The Pattern: Everything Looks Right, Nothing Is Working
If you’re an operating partner or portfolio company CEO reading this, the scenario probably sounds familiar. Your company has checked every box:
- Marketing team in place (maybe 3 to 6 people)
- Ad spend active (Google Ads, Meta, LinkedIn, maybe Amazon, or programmatic)
- Multiple agencies engaged (one for paid search, one for SEO, maybe a creative or dev shop)
- CRM and marketing automation running (HubSpot, Salesforce, Marketo)
- Content being produced (blog posts going out, emails sending, social media posting)
Yet when the board asks about pipeline growth, cost per acquisition, or marketing’s contribution to revenue, the answers come with caveats. The numbers from the CRM don’t match the numbers from Google Analytics. The agencies all report strong channel performance. But the top line number is not moving.
This is not a budget problem. According to Gartner’s 2025 CMO Spend Survey, marketing budgets sit at 7.7% of company revenue on average. For a $50 million portfolio company, that��’s roughly $3.85 million a year going into marketing. The money is being spent. The question is why it is not producing proportional revenue growth.
And the answer, in our experience across multiple portfolio company assessments, is almost never that the agencies are bad or the team is incompetent. The answer is that something is missing between the execution and the business outcomes. We call it the strategic layer gap.
What Is the Strategic Layer Gap?
The strategic layer is the senior marketing leadership function that connects marketing execution to business outcomes. It sits between the team doing the work (running campaigns, managing agencies, producing content) and the executive team that cares about revenue, customer acquisition cost, unit economics, and growth trajectory.
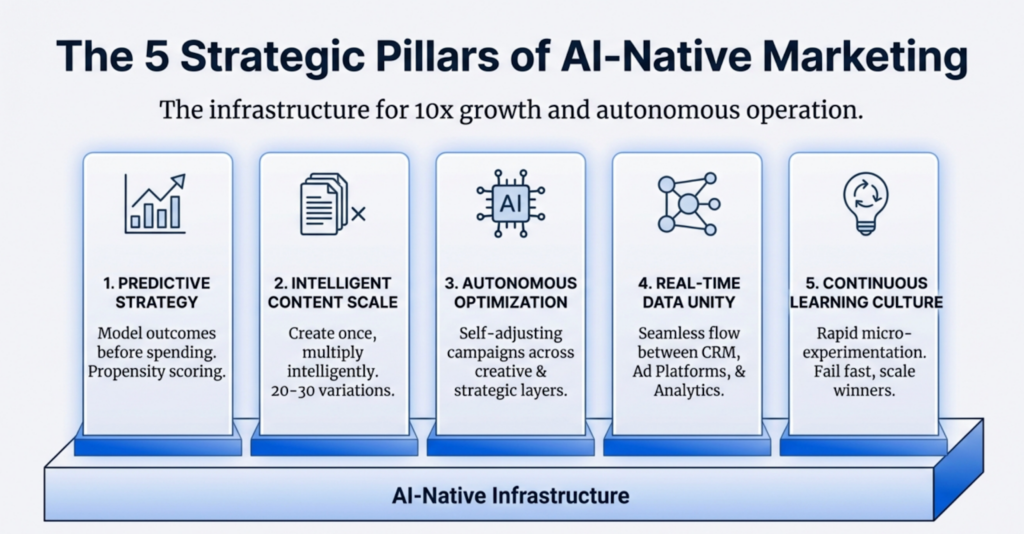
When the strategic layer is present, whether through a strong CMO, a fractional CMO, or an experienced VP of Marketing with real authority, it performs seven core functions:
- Cross-channel budget allocation. Seeing all marketing activities as a connected system, not isolated channels. Redirecting spend from underperforming areas to high-performing ones based on revenue data, not channel metrics.
- Attribution infrastructure. Owning the MarTech stack and reporting so that marketing activity maps directly to P&L impact. Making sure the CRM, analytics platforms, and ad channels all tell the same story.
- Unit economics analysis. Calculating CAC by channel, segment, and product line. Measuring LTV and payback period by customer segment. Knowing which customers are profitable to acquire and which lose money.
- Agency accountability. Holding agencies accountable to business outcomes, not impressions, clicks, or “traffic.” Evaluating whether $200K+ a year in combined agency fees is producing proportional revenue.
- Marketing to finance translation. Speaking both marketing and finance languages. Preparing board-ready deliverables that explain marketing performance in business terms.
- Infrastructure diagnosis. Identifying broken CRM workflows, attribution gaps, and email automation failures that the team cannot see because they built the system.
- Strategic prioritization. Taking a 150 to 200-item marketing to-do list and putting it in the right order based on dollar impact and implementation speed.
When this layer is missing, marketing becomes an activity without direction. The team keeps executing. The agencies keep reporting. The money keeps flowing. But nobody connects any of it to revenue. And the financial impact is not small.
Conservatively, the strategic layer gap causes 15 to 25% of total marketing spend to go toward activities that produce no revenue. For a company investing $12 million a year in marketing, that’s $300K to $500K in annual waste, compounding every quarter the gap persists.
Why the Strategic Layer Goes Missing at PE-Backed Portfolio Companies
This isn’t random. There are five specific reasons the strategic layer disappears at growth-stage companies, and all of them are common in the PE portfolio environment.
1. The CMO Departed and Was Not Replaced
This is the most common trigger. The CMO or VP of Marketing leaves. The company decides to “see how the team does” or “wait for the right hire.” Meanwhile, the team keeps executing the last strategy they were given. Spending continues. Strategy stops. Three months later, nobody remembers that the campaigns running today were designed for a market that no longer exists.
2. The Company Never Had a CMO
Many portfolio companies in the $20M to $100M range grew without senior marketing leadership. Marketing scaled organically: they hired people to run channels, brought on agencies to manage campaigns, and the CEO or COO provided intermittent direction. It worked at $10M. At $50M, with multiple channels, three agencies, and a complex funnel, nobody can see the full picture.
3. Marketing Reports to a Non-Marketing Executive
When marketing reports to the COO, CFO, or CEO, someone who is excellent at running the business but lacks expertise in marketing infrastructure, the function operates without informed oversight. The executive knows revenue is flat. They don’t know how to evaluate whether the Google Ads agency is doing a good job or whether the CRM is configured correctly.
4. The “CMO” Is Actually a Marketing Manager
Title inflation is real. Some portfolio companies have a “CMO” who is functionally a marketing manager, skilled at managing campaigns and vendors, but lacking the scope, authority, or experience to perform the strategic layer functions described above. They can execute. They cannot diagnose.
5. Agencies Were Hired as Strategy Replacements
This is the most expensive version of the gap. The company brings on agencies expecting them to provide both strategy and execution. But agencies optimize within their channel silo. The Google Ads agency makes Google Ads better. The SEO agency improves rankings. Neither one asks whether the company is targeting the right customer segments, whether the CRM is capturing leads correctly, or whether the unit economics justify the spend.
| The Operating Partner’s Dilemma: You can see the symptoms (flat revenue despite active marketing), but you are not a marketer. You cannot diagnose whether the problem is the team, the agencies, the channels, or the infrastructure. And nobody in the portfolio company can give you a straight answer, because nobody has a complete view of the system. |
Three Configurations PE Firms Try That Don’t Work
When portfolio company marketing problems become undeniable, PE firms and portfolio company executives typically try one of three solutions. All three address symptoms. None addresses the root cause.
Configuration 1: Add More Agencies
The logic seems sound: if one agency isn’t producing results, hire a specialist for each channel. One for paid search. One for SEO. One for creative. Maybe a dev shop for the website.
The result is vendor sprawl without accountability. We assessed a company last year with over $200,000 in combined annual agency fees across two vendors. Both agencies reported strong metrics, good click-through rates, improving rankings, and healthy email open rates. Revenue was flat. Neither agency was connected to the CRM in a way that tracked their work through to revenue outcomes. Each agency optimized for the metrics they could control and reported those metrics as success.
More agencies without marketing strategic oversight do not solve the problem. It multiplies it.
Configuration 2: Hire a Full-Time CMO
This is the right instinct at the wrong speed. A strong CMO hire takes 4 to 6 months to find, costs $250K+ in salary plus benefits, takes another 3 to 6 months to fully ramp, and carries significant fit risk. Many growth-stage companies cycle through two or three CMO hires before finding the right person.
Meanwhile, every month without strategic leadership is a month of compounding waste. If the strategic layer gap costs $30K to $40K per month in misdirected spend (a conservative estimate for companies in this range), a 12-month CMO search costs $360K to $480K in hidden losses before the new hire writes their first strategy document.
The other problem: you don’t know what kind of CMO you need until someone maps the current state. Hiring a brand CMO when you need a demand gen leader (or vice versa) is an expensive mistake that a diagnostic could prevent.
Configuration 3: Cut the Budget
When marketing is not clearly connected to revenue, it looks like overhead. And when PE firms see overhead, they cut it. The 2025 Gartner CMO Spend Survey found that 39% of CMOs are reducing agency spend. On the surface, this makes sense.
But cutting marketing spend without diagnosing the root cause is like reducing the medication dose because you don’t see improvement, without checking whether the medication was the right prescription in the first place. You might be cutting channels that were actually working but had broken attribution.
In the diagnostic we referenced earlier, the portfolio company’s leadership team had written off Meta as a failed channel based on CRM reports showing minimal leads. When we rebuilt the attribution model, Meta was actually their lowest cost acquisition source at under 3% cost of acquisition. They were about to kill the one channel that was performing.
Five Signs Your Portfolio Company Has a Strategic Layer Gap
These are the patterns we find most frequently when we run independent assessments of portfolio company marketing. If you recognize three or more, the strategic layer gap is almost certainly present.
Sign 1: Nobody Can Confidently Answer “What’s Our CAC?”
Ask the CEO, CFO, and marketing lead the same question: “What does it cost us to acquire a customer?” If you get three different numbers, or if any answer comes with heavy caveats, the measurement infrastructure is broken. Marketing calculates CAC one way. Finance uses a different methodology. Neither connects to the ad platform data. Decisions are being made on unreliable data.
We see this in the majority of companies we assess. Not because anyone is being dishonest, but because nobody owns the connection between marketing spend and customer-level financial data.
Sign 2: Each Agency Reports Great Metrics, but Revenue Is Flat
This is the classic “three agencies, flat revenue” pattern. The Google Ads agency reports strong CTR and low CPC. The SEO agency shows ranking improvements. The email team hits solid open rates. Every channel looks healthy in isolation. But when you zoom out to the P&L, nothing has changed.
The problem is that agencies are accountable to channel metrics, not revenue. They hit their KPIs. But their KPIs were never connected to business outcomes in the first place. Without marketing strategic oversight that holds vendors to revenue level results, you get activity reports that look great and financial results that don’t.
Sign 3: Attribution Numbers Don’t Match Across Platforms
Google Ads says 200 conversions. The CRM shows 85 leads from Google. GA4 reports 140 sessions with conversion events. Which number is real?
The answer is usually “none of them.” Attribution window misalignment is one of the most common PE portfolio company marketing problems we find. Meta uses a 7-day click window by default. The CRM might use a 30-day window. GA4 has its own methodology. If nobody has aligned these systems, channel performance is misreported by 50 to 200%. Channels that appear to fail might actually be your best performers.
Sign 4: Marketing Budget Keeps Growing, Revenue Doesn’t Follow
If marketing spend grew 20 to 40% over the past two years but revenue grew 5% or less, something is structurally wrong. Healthy marketing programs show a proportional (or better than proportional) relationship between incremental spend and incremental revenue.
When the relationship breaks, it is usually because the budget is being allocated based on past patterns rather than current performance. Each agency gets its fixed monthly budget regardless of results. The best-performing channels are underfunded because attribution is broken. The worst-performing channels continue to receive budget because nobody has a cross-channel view.
Sign 5: There Is No Prioritized Roadmap
Ask the marketing team for their top three priorities this quarter. If you get a list of 15 items with no clear ranking, or if different team members give you different lists, there is no strategic direction. The team is executing a never-ending to-do list without knowing which items have the highest revenue impact.
We commonly find portfolio companies with 150 to 200 items on the marketing to-do list and nobody who can sort them by business impact. Everything feels equally urgent because nobody has the cross-functional visibility to calculate which items actually move the revenue needle.
Why This Matters Now: The Shift in Private Equity Value Creation
The strategic layer gap has always been expensive. But the current PE environment makes it critical. McKinsey’s 2024 analysis of 100+ PE funds found that firms focused on operational value creation earn 2 to 3 percentage points higher IRR than those relying on financial engineering and multiple expansion.
The math is clear: the era of buying companies, applying leverage, and selling at a higher multiple is over. Buyout entry multiples have compressed. According to the McKinsey Global Private Markets Report, average holding periods have stretched to 6.7 years, the longest since 2005. With over 18,000 companies held beyond the traditional 4-year horizon, PE firms need their portfolio companies to grow revenue organically.
Bain’s Global PE Report confirms it: revenue growth has driven 53% of all PE value creation since 2010. Margin improvement contributed just 4%. That means more than half of the value creation PE firms rely on comes from top-line growth. And for most portfolio companies, marketing is the primary engine for top-line growth.
So when the strategic layer gap causes 15 to 25% of marketing spend to produce no revenue, the impact extends beyond wasted budget. It directly affects EBITDA improvement, valuation at exit, and fund-level returns.
What Fixing the Strategic Layer Gap Looks Like in 90 Days
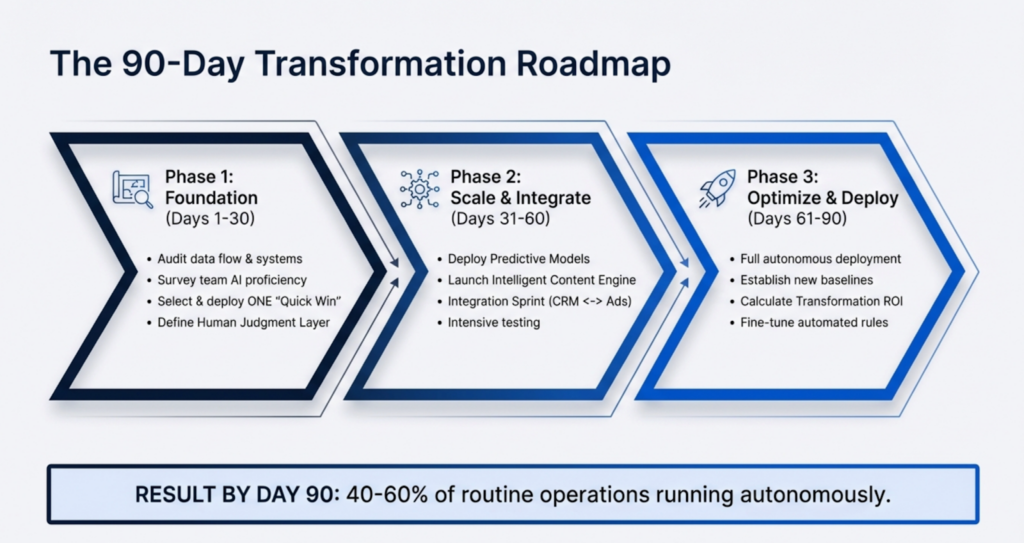
The good news is that the strategic layer gap is fixable. And in our experience, the highest impact fixes often take days or weeks, not months. Here is what an effective 90-day repair looks like.
Phase 1: Independent Diagnostic (Weeks 1 to 4)
Before you can fix anything, you need a clear picture of what’s broken. An independent, system deep diagnostic (not a free audit from an agency that wants your business) goes into the CRM backend, ad platform accounts, analytics configuration, email automation logic, and financial data to find what the internal team cannot see.
What this typically uncovers:
- CRM routing failures. Leads entering dead queues, email sequences skipping steps, and duplicate routing. These issues affect 30 to 60% or more of paid leads in the companies we assess.
- Attribution misalignment. Channels being credited (or blamed) for performance that belongs to other channels. We’ve seen companies on the verge of shutting down their best acquisition channel because tracking was broken.
- Quality Score degradation. Google Ads accounts with 50 to 70% of spend going to keywords with Quality Scores of 1 to 3, when the industry benchmark is 7+. This means paying 2 to 3 times more per click than a properly optimized account.
- Unit economics blind spots. Companies reporting a single blended CAC when segment-level analysis reveals some customer types are highly profitable and others actually lose money.
- Agency accountability gaps. Vendors being measured on channel metrics (CTR, rankings, open rates) with no connection to revenue outcomes.
The diagnostic produces a prioritized roadmap that separates quick wins (fixes that take hours or days and have immediate impact) from long-term builds (infrastructure projects that take weeks to months but compound over time).
Phase 2: Quick Wins and Infrastructure Repair (Weeks 4 to 8)
With the roadmap in hand, execution starts with the highest impact, lowest effort items. In the financial services diagnostic we described, the quick wins included:
- Fixing the CRM field default that was killing the majority of paid leads (a fix that took under 30 minutes, reactivating nearly $1.5M in pipeline)
- Rebuilding attribution windows across Meta, Google Ads, and the CRM to get a single source of truth
- Restructuring the Google Ads account to move spend away from low Quality Score keywords to properly optimized campaigns
- Reconnecting offline conversions to ad platforms so algorithms could optimize for customers, not just leads
- Resetting agency KPIs from channel metrics to revenue-connected outcomes
None of these are complex. All of them were invisible to the team and agencies because nobody was looking at the full system. That is what the strategic layer does.
Phase 3: Ongoing Strategic Leadership (Weeks 8+)
Once the highest priority items are fixed, the work shifts to ongoing strategic leadership: monthly budget reallocation based on performance, agency management, reporting that connects marketing spend to revenue outcomes, and board-ready deliverables that translate marketing performance into the financial language PE firms expect.
This can be provided through a full-time CMO hire (if you now know what kind of CMO you need), a fractional CMO engagement (if you need strategic leadership immediately while deciding on a permanent hire), or a combination of both.
According to Forrester’s research across 400+ B2B organizations, companies with aligned sales, marketing, and product functions achieve 19% faster revenue growth and 15% higher profitability. That alignment doesn’t happen by accident. It happens when someone owns the connection between marketing execution and business outcomes.
How Azarian Growth Agency Approaches the Strategic Layer Gap

At Azarian Growth Agency, we have spent over six years working with growth-stage companies on exactly this problem. We’ve managed more than $40 million in ad spend, helped clients raise over $300 million in funding, and run independent marketing diagnostics that have uncovered millions in hidden pipeline and wasted spend.
Our approach is built on three principles:
Independence first. We charge for our diagnostics because independent analysis requires independence from the outcome. We are not selling you our agency services disguised as an audit. When we find that your existing agency is doing a good job on a specific channel, we say so. When we find that a channel needs to be shut down, rebuilt, or reassigned, we say that too.
System deep, not surface level. We go into the CRM backend, the ad platform accounts, the email automation logic, the analytics configuration, and the financial data. We are not reviewing dashboards and reports. We are tracing individual leads from ad click through CRM entry to first email to sales contact to revenue. That is where the problems hide.
Diagnosis and fix, not a strategy deck and a handshake. Management consulting firms charge $500K+ to deliver a strategy deck and walk away. We deliver the diagnosis, build the roadmap, and stay to execute it. Our fractional CMO engagements provide ongoing strategic leadership at a fraction of the cost of a full-time hire, with faster time to value and lower risk.
The Bottom Line
If your portfolio company has a marketing team, active ad spend, multiple agencies, and flat revenue, the problem is almost certainly not that the people are wrong or the money is not enough.
The problem is the marketing strategy gap between execution and business outcomes. It is the missing layer that nobody owns. The CRM misconfigurations that nobody catches. The attribution failures that make good channels look bad and bad channels look good. Nobody has calculated the unit economics at the segment level.
Every month this gap persists, it costs the company $30K to $100K or more in misdirected spend, lost pipeline, and missed revenue. Over a 6.7-year average hold period, that is a drag on EBITDA, valuation, and fund returns that compounds quietly until it becomes undeniable.
The fix starts with seeing the full picture. Not a dashboard summary. Not an agency’s self-reported metrics. A system deep diagnostic that shows you exactly where the money is going, what is working, what is not, and what to fix first.
| Five questions every operating partner should be able to answer about their portfolio company’s marketing: 1. What is our true customer acquisition cost, by channel and by customer segment? 2. How many of the leads we pay for actually receive a follow-up email within 24 hours? 3. Which channels are optimizing for leads vs. which are optimizing for customers? 4. What are the unit economics (CAC, LTV, payback period) by customer segment? 5. Who owns the connection between our marketing spend and our revenue outcomes? If you cannot answer these questions with confidence, the strategic layer gap is costing your portfolio more than you think. |
Sources
- Gartner 2025 CMO Spend Survey: Marketing budgets at 7.7% of revenue; 39% of CMOs reducing agency spend. Survey of 402 CMOs. https://www.gartner.com/en/newsroom/press-releases/2025-05-12-gartner-2025-cmo-spend-survey-reveals-marketing-budgets-have-flatlined-at-seven-percent-of-overall-company-revenue
- McKinsey, Bridging Private Equity’s Value Creation Gap (April 2024): Firms focused on operations earn 2 to 3% higher IRR. Analysis of 100+ PE funds. https://www.mckinsey.com/industries/private-equity-and-principal-investors/our-insights/bridging-private-equitys-value-creation-gap
- Bain Global Private Equity Report: Revenue growth drove 53% of value creation since 2010. Margin improvement drove 4%. https://www.bain.com/insights/topics/global-private-equity-report/
- McKinsey Global Private Markets Report: Average PE hold period 6.7 years, longest since 2005. https://www.mckinsey.com/industries/private-capital/our-insights/global-private-markets-report-2025
- PwC, Future of Portfolio Company Value Creation: PE firms adjusting value creation plans to prioritize organic growth and commercial effectiveness. https://www.pwc.com/us/en/services/consulting/deals/portfolio-company-value-creation.html