
Six months into a PE-backed portfolio company engagement, I asked a straightforward question: “How many leads from your paid campaigns actually received a follow-up email?”
The marketing team ran the report. The room went quiet.
Sixty-two percent of the leads they had paid to generate had never received a single email. Not a welcome message. Not a nurture sequence. Nothing.
The root cause was not a deliverability problem. It was not a team capacity problem. It was a single CRM field, set to the wrong default value during a platform migration six months earlier. One field. Hundreds of thousands of dollars in wasted ad spend. More than $1.8 million in pipeline that had quietly vanished.
This is what a marketing diagnostic actually finds.
Not surface-level campaign metrics. Not a repackaged agency pitch. The specific, dollar-quantified infrastructure failures that your marketing team cannot see because they built the system, your agencies cannot see because they only have access to their own channel, and your CFO cannot see because nobody connected the data.
If your PE-backed portfolio company is spending $500,000 or more annually on marketing and revenue growth has plateaued, the findings below will likely feel uncomfortably familiar.
What a Marketing Diagnostic Is (And What It Is Not)
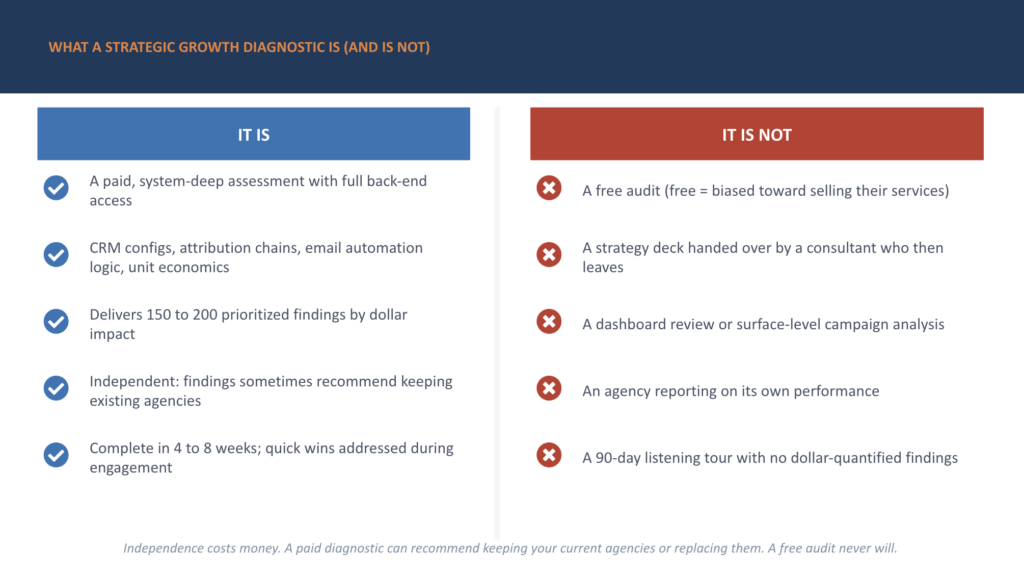
The term “audit” gets used loosely in marketing. An agency offers a free audit. A consultant delivers a strategy deck. A fractional hire does a 30-day listening tour.
A Strategic Growth Diagnostic is none of those things.
It is a paid, system-deep assessment that goes inside CRM configurations, attribution chains, ad platform accounts, email automation logic, unit economics models, and agency contracts. The diagnostic produces a prioritized roadmap of 150 to 200 findings, organized by dollar impact and implementation complexity.
The word “paid” matters. Independence costs money. Free audits are sales pitches in disguise. A paid diagnostic with full system access can recommend keeping your current agencies, restructuring them, or replacing them entirely. That kind of objectivity is only possible when there is no financial incentive tied to the recommendation.
What a Marketing Diagnostic Actually Finds: 8 Common Categories
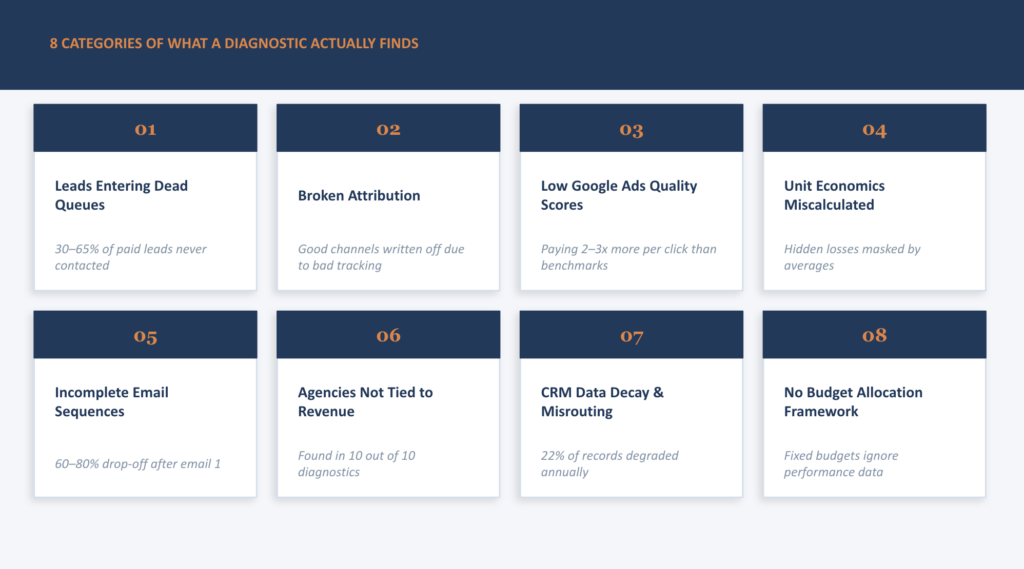
Across our diagnostics at PE-backed portfolio companies with $20M to $200M in revenue, the same infrastructure failures appear repeatedly. Here are the eight most common categories, with specific examples from real engagements.
1. Leads Entering Dead Queues
This is the most financially damaging finding we encounter. Research from InsideSales.com shows that 51% of leads across 10,000 companies analyzed were never contacted at all. In our own diagnostic work, we consistently find 30 to 65% of paid leads never receiving follow-up.
The root cause is almost always a CRM configuration error, not a team failure. Common examples include:
- A field mapping set to “Unqualified” instead of “Lead” during a platform migration
- A workflow trigger that fires only when a custom property equals a value that is never populated
- An email sequence enrollment condition that accidentally excludes the primary lead source
Finding from a recent portfolio company diagnostic: 62% of paid leads never received a follow-up email.
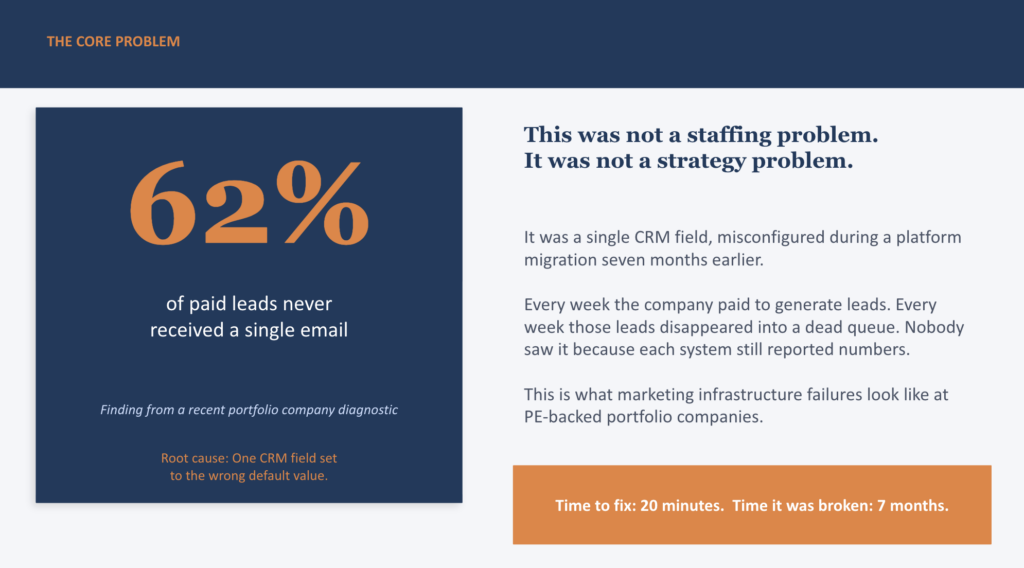
Root cause: A single CRM default field set incorrectly during a HubSpot migration.
Time to fix: 20 minutes.
Time it had been broken: 7 months.
The Harvard Business Review found that companies responding to leads within one hour are seven times more likely to qualify the lead than those who respond even one hour later. At an average B2B lead response time of 42 hours, the revenue cost of dead queue failures compounds daily.
2. Broken Attribution That Kills Good Channels
This is the finding that produces the most immediate relief in the room. We walk in, and someone tells us a channel “does not work.” We pull the data. The channel works fine. The tracking does not.
Attribution window misalignment is the most common form. Meta uses a 7-day click window by default. The CRM uses a 30-day window. Neither system is wrong, but when nobody reconciles the two, the company makes channel allocation decisions based on a number that does not reflect reality.
In one diagnostic, a Meta channel had been written off as underperforming for an entire quarter. The CEO was ready to reallocate the budget to Google. After reconciling attribution windows and reconnecting the conversion API, Meta turned out to be the lowest-cost acquisition source in the entire portfolio.
We also encounter UTM parameter failures in the majority of diagnostics. When 60 to 80% of conversions are attributed to “direct traffic” or “(none)” in GA4, the channel data becomes useless. Companies end up cutting channels that work and funding channels that do not because the signal is inverted.
3. Google Ads Quality Scores Below Industry Benchmark
In seven out of ten Google Ads accounts we assess, 50 to 70% of ad spend is going to keywords with Quality Scores of 1 to 3. The industry benchmark is 7 or above.
Quality Scores directly affect cost-per-click. A Quality Score of 3 on a keyword worth $8 per click often costs $20 to $24 per click once Google applies its penalty multiplier. For a company spending $120,000 per year on Google Ads, low Quality Scores can add $5,000 to $10,000 in excess monthly spend.
The agencies managing these accounts are not hiding this data. They often simply are not checking it. Their performance reports focus on CTR, conversion rate, and monthly spend. Nobody is pulling the Quality Score distribution report and connecting it to P&L impact.
4. Unit Economics Calculated Incorrectly or Not at All
When we ask “What is your cost to acquire a customer?” in the first diagnostic interview, the answer almost always includes caveats. “Our CMO has one number, finance has a different one.” “It depends on which channel.” “We are not sure how to count the trial period.”
According to Gartner research, only 52% of CMOs can demonstrate marketing’s value to their CFO. The problem is not that marketing does not create value. The problem is that nobody has connected the channel data to the customer-level financial data.
In 9 out of 10 diagnostics, we find CAC calculated as an organization-wide average. Nobody has broken it down by customer segment, acquisition channel, or product line. The result is that unprofitable customer segments are hidden inside the average. A company might be acquiring customers at an average cost that looks reasonable while simultaneously losing money on every customer in a specific segment.
In one engagement, calculating CAC by segment revealed that one customer segment had a lifetime value of approximately $900 at a $200 acquisition cost, while another segment had a lifetime value of negative $100 at a $300 acquisition cost. The company was running equal ad spend to both segments.
5. Email Automation Sequences Incomplete
According to MarketingSherpa, 79% of marketing leads never convert to sales. The most cited reason is insufficient nurturing. In 4 out of 10 diagnostics, we find nurture sequences where the first email sends correctly and everything after it fails silently.
The failure mode looks like this: a trigger fires on a custom property value that is never populated, or an enrollment condition excludes contacts who came in through a specific source, or a wait step is set to a duration that accidentally conflicts with an unenrollment rule.
Nobody notices because open rates look normal. The first email always works. The performance degradation from incomplete sequences only shows up when you track progression rates: if 1,000 contacts enter a sequence, how many reach email 2, email 3, email 4? In these broken sequences, the number drops by 60 to 80% after the first send.
6. Agencies Accountable to Channel Metrics, Not Revenue
This finding appears in 10 out of 10 diagnostics. It is the most universal problem we encounter. Every agency involved in marketing execution is reporting on metrics that make them look good. Nobody is connecting any of those metrics to revenue.
The Google Ads agency reports strong CTR and volume. The SEO agency reports ranking improvements. The email agency reports open rates. Revenue is flat. Each agency believes they are performing. The company is paying $200,000 to $400,000 per year in combined agency fees without a single contract that ties compensation to customer acquisition cost or revenue contribution.
The fix is not firing the agencies. In most cases, the agencies are executing competently within the scope they were given. The fix is adding the strategic layer that connects their execution to business outcomes, holds them accountable to the right metrics, and reallocates budget across channels based on actual revenue contribution rather than channel-level reporting.
7. CRM Data Decay and Misrouting
B2B contact data decays at approximately 2% per month according to HubSpot research, which means roughly 22% of your contact records are degraded annually. For companies that have been operating for 3 or more years without a data hygiene process, the problem is compounding.
Gartner estimates that poor data quality costs organizations an average of $12.9 million per year. For a midsize portfolio company, Forrester puts the number closer to $1.2 million annually in media waste alone from targeting degraded records.
We also consistently find lead misrouting: leads assigned to sales reps who have left the company, territory mapping logic that has not been updated after a restructuring, and round-robin assignment rules that break when headcount changes. Roughly 25% of marketing-generated leads in the average portfolio company go to the wrong person or to nobody at all.
8. No Cross-Channel Budget Allocation Framework
The final universal finding: no one person or function has both the authority and the data to reallocate budget across channels in real time. The Google Ads budget is fixed. The SEO retainer is fixed. The content budget is fixed. Each line item exists in its own silo, reviewed annually at best.
Research from BCG and Google found that companies with data-driven cross-channel budget allocation achieve 30% cost savings and 20% revenue increases compared to those without. At a portfolio company spending $2 million annually on marketing, that gap represents $400,000 in recoverable budget annually.
In the absence of a strategic layer with cross-channel visibility, budgets stay fixed at whatever they were when they were last set. Underperforming channels continue to receive allocation. High-performing channels that could scale are constrained. The misallocation compounds every month.
What This Costs: A Composite Picture for a $50M Portfolio Company
To make the math concrete, here is a conservative model of cumulative annual revenue leakage from these eight categories at a PE-backed company generating $50 million in revenue with $2 million in annual marketing spend:
| Leakage Category | Conservative Estimate | Driver |
| Lead follow-up failure (62% unworked) | $900K to $2.1M/year | Ad spend with no revenue return |
| Attribution-driven channel misallocation | $400K to $520K/year | 26% of $2M budget on wrong channels |
| Media waste from CRM data decay | $420K/year | 21 cents per dollar on degraded records |
| Sales productivity from misrouting | $180K to $320K/year | Rep time on dead or duplicate leads |
| Excess Google Ads CPC from low Quality Scores | $60K to $120K/year | 2 to 3x CPC premium on 60% of spend |
| Total Combined Leakage | $1.8M+ per year | Before opportunity cost |
These are conservative estimates. The actual number at most portfolio companies is higher, particularly when you account for opportunity cost: the compounding revenue that would have been generated if the budget had been allocated correctly 12 to 18 months earlier.
Why These Problems Stay Hidden
The same structural reasons cause these diagnostic findings to persist for months or years without detection.
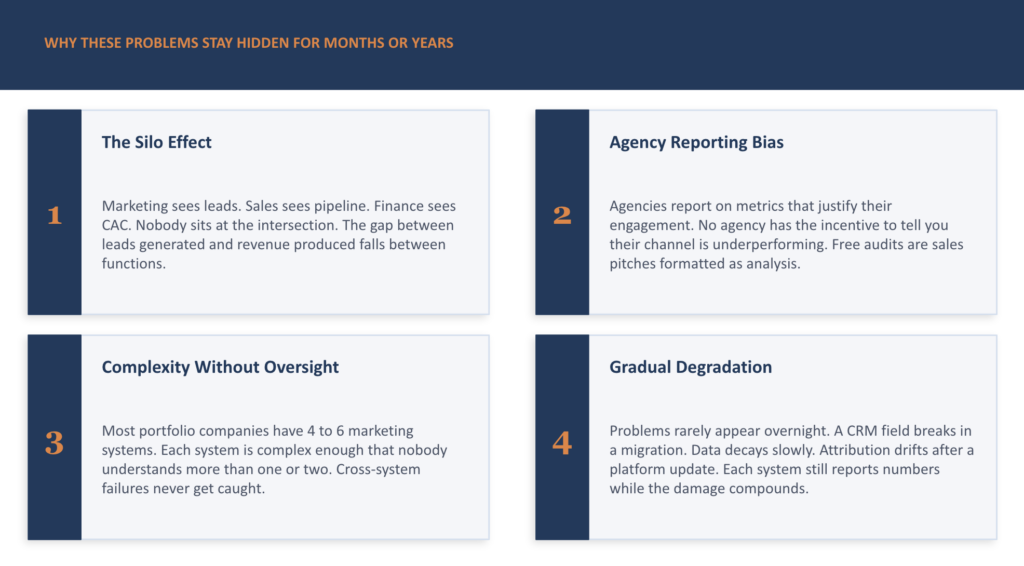
The Silo Effect
Marketing sees leads, traffic, and engagement. Sales sees pipeline and close rates. Finance sees CAC, LTV, and margin. Nobody sits at the intersection of all three. The gap between “leads generated” and “revenue produced” falls between functions without a clear owner.
Agency Reporting Bias
Agencies report on metrics that justify their continued engagement. A Google Ads agency will never include a Quality Score distribution report in a monthly update if that report reveals the account needs a complete rebuild. A free audit from an agency is a sales pitch formatted as an analysis.
Complexity Without Oversight
Most portfolio companies in the $20M to $200M range have accumulated four to six marketing systems: a CRM, an ad platform suite, a marketing automation tool, an analytics platform, a landing page builder. Each system is complex enough that nobody fully understands more than one or two of them. Diagnostic failures that require cross-system analysis never get caught by anyone operating inside a single system.
Gradual Degradation
These problems almost never appear overnight. A CRM field breaks during a migration. Data decays slowly. Attribution drifts out of alignment after a platform update. Each individual system still reports numbers. Revenue growth slows, but the connection between the degraded infrastructure and the stalled growth is not obvious until someone maps the full system.
How a Diagnostic Finds What Nobody Else Found
The findings above are not the result of running the same reports your team already runs. They come from a specific methodology that most internal teams and external agencies cannot apply.
Full System Access, Not Dashboard Access
A Strategic Growth Diagnostic requires direct access to CRM back-end configurations, ad platform accounts at the admin level, email automation workflow logic, GA4 raw data, and financial data from the CFO. Dashboard access shows you what the system is designed to show you. Back-end access shows you what the system is actually doing.
Cross-Platform Data Reconciliation
We pull lead counts, conversion events, and customer records from every system for the same date range, then reconcile them. When the numbers do not match, we follow the discrepancy until we find where the data breaks. This is how the 62% unworked lead finding surfaces: the CRM showed the leads, but the email platform showed they never enrolled.
Unit Economics Built From Source Data
We do not accept the company’s existing CAC calculation. We build it from the source: marketing spend by channel, leads by channel, customers by channel, and customer revenue by segment. This is the only way to find the hidden losses inside the average.
Pattern Recognition Across Engagements
The most valuable diagnostic capability is knowing what normal looks like. When you have run 20 or more diagnostics across companies in financial services, SaaS, healthcare, and DTC, you recognize the patterns. You know that a “direct traffic” share above 40% in GA4 almost always indicates broken UTM parameters. You know that when a company cannot answer “What is our CAC?” consistently across the CEO, CFO, and head of marketing, the calculation is broken.
About Azarian Growth Agency
Azarian Growth Agency helps PE-backed portfolio companies figure out why their marketing is not scaling, then fixes it.
Our work begins with a paid Strategic Growth Diagnostic: a system-deep assessment of channel performance, CRM configuration, attribution infrastructure, unit economics, email automation, competitive positioning, and agency accountability. The diagnostic delivers a prioritized roadmap of 150 to 200 findings, organized by dollar impact and implementation complexity.
Most companies that engage us for a diagnostic find, within the first two weeks, at least one infrastructure failure they had no visibility into. The $1.8 million lead routing failure described in this article was not an outlier. It is a representative example of what goes undetected in the absence of a strategic layer with full system access.
Following the diagnostic, companies have the option to move into a Fractional CMO engagement where Azarian Growth Agency implements the roadmap, manages vendor accountability, builds attribution infrastructure, and provides ongoing strategic leadership at a fraction of the cost and timeline of a full-time CMO hire.
Azarian Growth Agency has managed over $40 million in advertising spend, supported companies that have raised over $269 million in funding, and built a repeatable diagnostic methodology validated across multiple PE-backed engagements in financial services, insurance, fintech, healthcare, and B2B SaaS.
If your portfolio company is spending more than $500,000 annually on marketing and cannot answer these three questions with confidence, a diagnostic conversation costs you nothing:
- What is our actual cost to acquire a customer, broken down by segment and channel?
- What percentage of our paid leads received a follow-up within 24 hours?
- Which of our marketing channels is actually driving revenue, not just volume?
Ready to find out what your diagnostic would uncover?
Talk with our growth experts or visit our Strategic Growth Diagnostic page to learn more about the engagement model.