Here is a number every PE operating partner should write down before the next portfolio review: companies relying on last-click attribution are routinely misreading 30 to 50 percent of their marketing performance data. Not off by a rounding error. Off by enough to change every capital allocation decision across every company in the portfolio.
When a portfolio company CEO says “Meta stopped working” or “paid search is our only efficient channel,” there is a real chance they are not describing channel performance at all. They are describing what a broken measurement system told them to believe. And because last-click is the default setting in most analytics platforms, those wrong conclusions get baked into board decks, annual budgets, and hold-period growth strategies before anyone asks where the data came from.
This article explains how last-click attribution works, why it produces systematically wrong data for PE-backed companies, what the dollar cost looks like at portfolio scale, and what fixing it actually requires. It is written for operators and investors, not for marketers.
What Last-Click Attribution Actually Does
Last-click attribution assigns 100 percent of conversion credit to the final marketing touchpoint before a customer completed an action. Someone clicks a branded Google search ad and fills out a form. Google gets full credit. The LinkedIn ad that introduced the brand three weeks earlier gets nothing. The nurture email that re-engaged the prospect last week gets nothing.
For simple, single-session transactions, this is an acceptable shortcut. For growth-stage companies with complex products, regulated industries, and long sales cycles, it is a systematic distortion of reality.
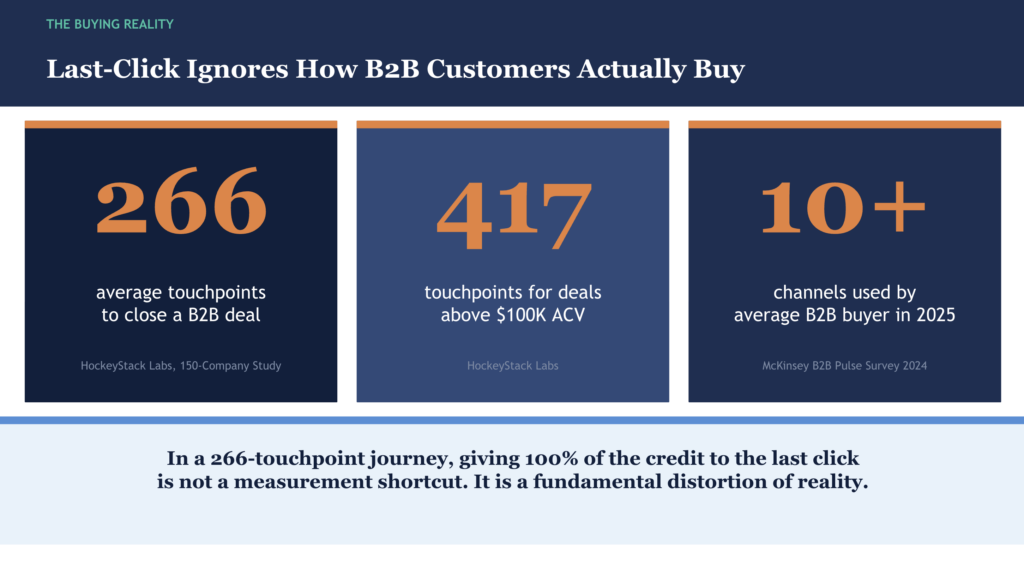
Consider what a B2B customer journey actually looks like today. Research from HockeyStack Labs, analyzing data across 150 B2B companies with revenue between $8 million and $2 billion, found that closing a deal requires an average of 266 touchpoints. Enterprise deals above $100K ACV require a closer to 417.
McKinsey’s 2024 B2B Pulse Survey found that B2B buyers now use an average of 10 channels throughout the purchase process, up from 5 in 2016. In that environment, giving all the credit to the last click is not just imprecise. It is a structural lie about which channels are actually generating revenue.
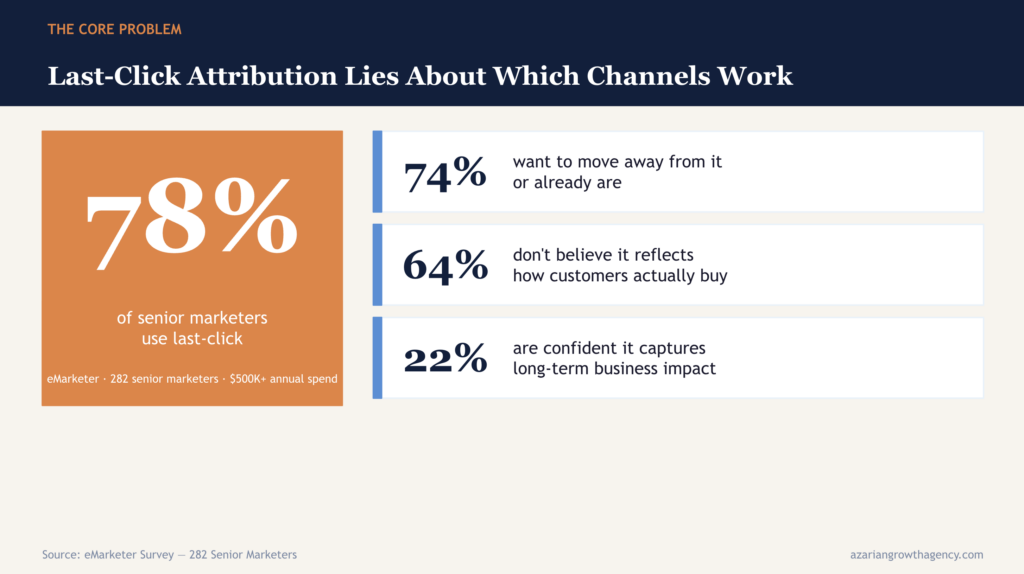
| The State of Last-Click in Practice An eMarketer survey of 282 senior marketers spending $500K or more annually on digital advertising found: – 78 percent use last-click to measure media performance – 74 percent want to move away from it or already are – 64 percent do not believe it reflects how customers actually buy – Only 22 percent are confident it accurately captures long-term business impact The industry knows last-click is broken. Most portfolio companies are still using it. |
The PE-Specific Damage Last-Click Attribution Creates
Most commentary on last-click attribution focuses on how it undervalues brand campaigns or social media. That framing misses the problem that matters most for PE-backed companies.
In a PE portfolio company, marketing decisions are not just channel decisions. They are capital allocation decisions. When the board asks for CAC, and the answer is built on last-click data, the CAC number is wrong.
When an operating partner reviews channel performance across the portfolio, the data is wrong. When a CFO builds unit economics models for an exit process, the underlying assumptions may be wrong.
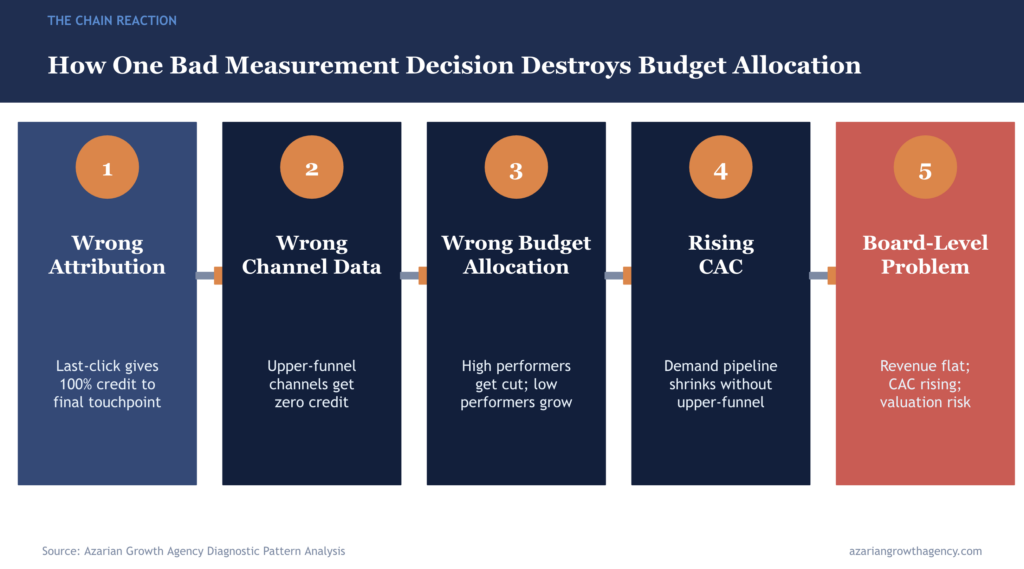
The compounding chain runs like this:
- Wrong attribution produces wrong ROAS and CAC data for each channel
- Wrong channel data drives wrong budget allocation decisions
- Wrong budget allocation over-funds low-performing channels and starves high-performing ones
- Underfunded high-performing channels deliver less pipeline over time
- Reduced pipeline shows up as rising CAC, declining LTV:CAC ratios, and flat revenue despite increased spend
- Flat revenue with increasing spend becomes a board-level problem, and eventually an exit valuation problem
Here is the pattern we see most frequently in PE-backed financial services, fintech, and B2B SaaS companies: a top-of-funnel channel, such as Meta or display advertising, is generating significant demand.
But because prospects take four to eight weeks to convert, the final touchpoint recorded under last-click is almost always branded search or direct traffic.
The upper-funnel channel gets zero credit. The team cuts it. Branded search appears to have exceptional ROAS for another quarter because it is capturing demand built by the channel that was just eliminated. Then, branded search collapses because there is no new demand feeding it.
The channel was never broken. The measurement was.
What This Costs at Portfolio Scale: A Dollar Framework
Forrester Consulting research found that midsize organizations lose more than $1 million per year, and enterprise organizations lose more than $16 million per year due to poor data quality in marketing measurement.
Gartner’s 2025 CMO Spend Survey found that marketing budgets have flatlined at 7.7 percent of company revenue, with 59 percent of CMOs reporting insufficient budget. In that environment, misallocating 20 percent of an already constrained budget is not a minor inefficiency. It is a strategic liability.
For a portfolio company with $50 million in revenue, spending 7.7 percent on marketing, that is roughly $3.85 million in annual marketing spend. A 20 percent misallocation from attribution failures alone represents $770,000 per year that could be redirected to channels that actually drive revenue growth. Across a 10-company portfolio with similar profiles, the aggregate capital misallocation from bad attribution data can exceed $7 million annually.
| Portfolio Size | Combined Annual Marketing Spend | Estimated Misallocation at 20% |
| Single Portfolio Company | $3.85M (at 7.7% of $50M revenue) | $770K |
| 5-Company Portfolio | $19.25M | $3.85M |
| 10-Company Portfolio | $38.5M | $7.7M |
| 15-Company Portfolio | $57.75M | $11.55M |
Illustrative model based on Gartner’s average marketing spend and Forrester misallocation research. Actual results vary by company, industry, and attribution maturity.
That misallocated capital does not disappear from the P&L. It funds channels that appear productive under last-click accounting, while the channels that are actually building demand get cut. Bain and Company research on PE portfolio company commercial excellence found that structured marketing analytics programs delivered an average revenue uplift of 27 percent.
That gap between companies that fix measurement and companies that do not reflects the actual financial stakes of attribution accuracy.
Five Attribution Failures PE Companies Encounter Most
After running Strategic Growth Diagnostics across portfolio companies in financial services, fintech, insurance, healthcare, and B2B SaaS, the same attribution failures appear repeatedly. These are not edge cases. They are the pattern.
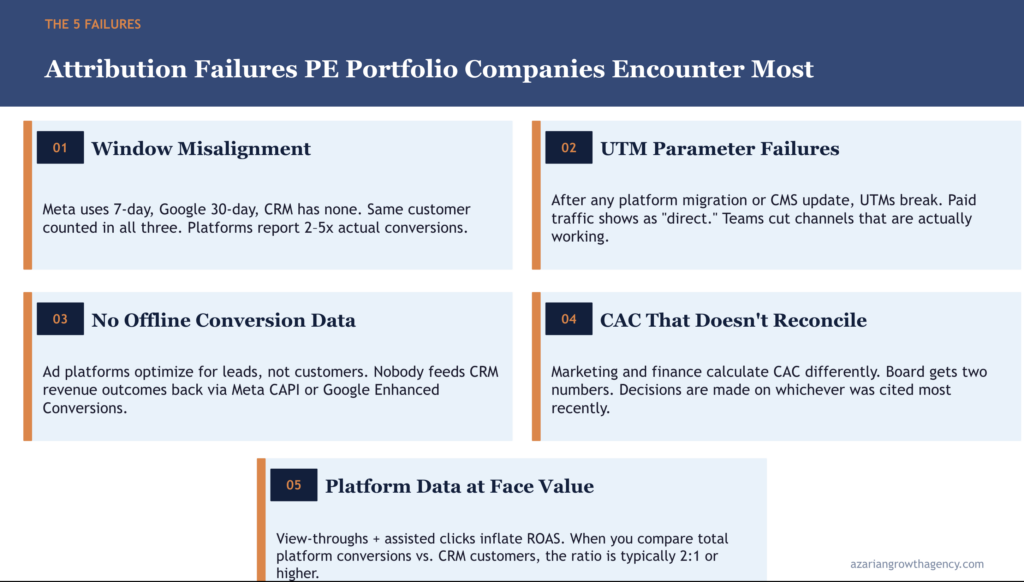
1. Attribution Window Misalignment Between Platforms
Meta defaults to a 7-day click attribution window. Google Ads uses 30 days. GA4 uses a session-based model. The CRM assigns no attribution window at all and records the last-known source. These four systems are counting conversions from different time periods, and nobody is reconciling them.
The practical result: the same customer appears to convert in three systems simultaneously. Ad platforms report two to five times more conversions than actually occurred. Budget decisions get made on numerators that are dramatically and systematically inflated.
2. UTM Parameter Failures
When UTM parameters break on landing pages after a platform migration, CMS update, or JavaScript error, GA4 stops receiving the traffic source. Paid traffic defaults to “direct” or “(none).” A paid campaign that consumed 40 percent of the month’s budget shows up as organic or direct traffic. The paid channel appears to have underperformed. The team starts cutting it.
A quick diagnostic check: if direct traffic in GA4 accounts for more than 30 percent of total conversions, there is almost certainly a UTM failure in the stack. We see this in more than half the companies we assess.
3. No Offline Conversion Data Fed Back to Ad Platforms
Ad platforms optimize for the conversion signals you give them. Most portfolio companies give them lead events, not customer events. Not revenue events. This means Meta and Google are optimizing for the cheapest leads, not the most valuable customers.
A campaign generating 500 low-quality leads will outperform a campaign generating 40 high-LTV customers on every platform dashboard, because the platform has no visibility into what those leads became. The fix is connecting CRM outcome data back to the platform via Meta’s Conversions API and Google Enhanced Conversions. Most portfolio companies have never done this.
4. CAC That Does Not Reconcile Between Marketing and Finance
Marketing calculates CAC using ad spend divided by leads. Finance calculates it using the total marketing cost divided by closed customers. When the board asks for CAC, they get two numbers that differ by 40 to 60 percent. Both teams defend their methodology. Nobody resolves the discrepancy, and budget decisions get made on whichever number was cited most recently.
Ask the CEO, CFO, and CMO for CAC independently. If the answers differ by more than 20 percent, the attribution infrastructure is broken.
5. Ad Platform Conversion Data Taken at Face Value
Meta’s reported ROAS includes view-through conversions. Google’s conversion reports include assisted conversions with varying attribution weights. These are not fabricated numbers, but they count things differently from what the CRM records as an actual customer. When you sum reported conversions across all ad platforms and compare to actual CRM customers for the same period, the ratio is almost always two to one or higher. The platforms are counting overlapping credit. Nobody is running that reconciliation.
| The Three-Question Board Test Before the next portfolio review, ask these three questions of each company’s marketing and finance leadership: – Question 1: What is our blended CAC, and what is CAC by channel? Do those numbers reconcile to the P&L? – Question 2: What percentage of our GA4 conversions show as direct or unknown source? If it is above 30 percent, where is the rest going? – Question 3: When we sum conversions reported across all ad platforms, does that total match customers in the CRM? The quality of the answers tells you more about marketing infrastructure maturity than any dashboard or agency report. |
What Multi-Touch Attribution Actually Fixes
Multi-touch attribution distributes conversion credit across all the touchpoints in a customer journey rather than concentrating it at the final click. Google’s own research on data-driven attribution found that advertisers switching from last-click saw conversion increases ranging from 29 to 62 percent at equivalent cost. These are not marginal improvements. They reflect the scale of the measurement distortion that last-click creates over time.
Forrester Research found that 75 percent of companies implementing multi-touch attribution report a 14 to 36 percent improvement in cost per acquisition. Companies switching from last-click see an average 19 percent lift in marketing ROI within the first year of implementation. That is the direct financial value of accurate measurement.
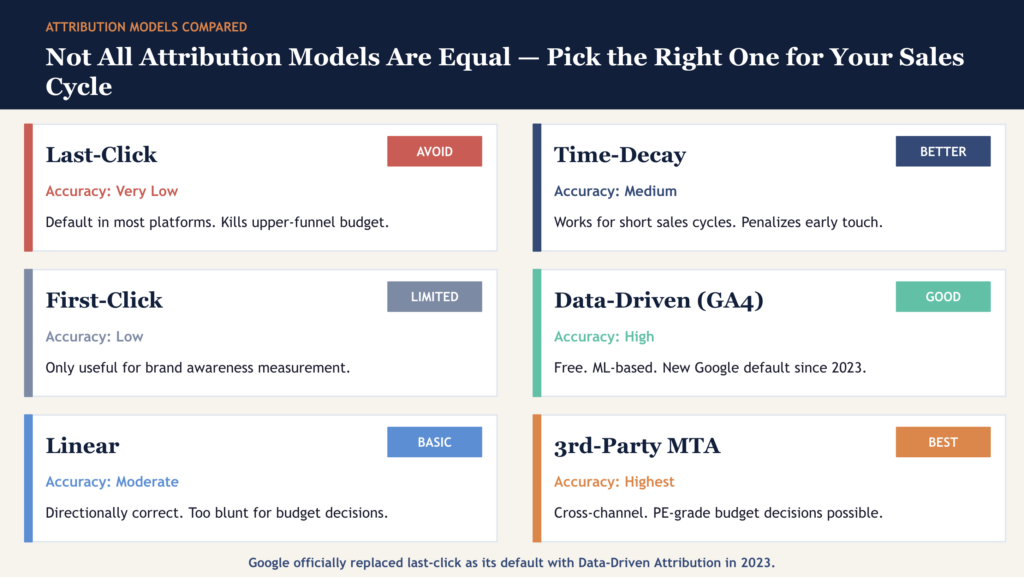
| Attribution Model | What It Does and When to Use It |
| Last-Click | 100% credit to the final touchpoint. Default in most platforms. Systematically underfunds upper-funnel channels. Avoid for any complex sales cycle. |
| First-Click | 100% credit to the first touchpoint. Useful only for measuring brand awareness reach. Not appropriate for budget allocation. |
| Linear | Equal credit to all touchpoints. Better than single-touch models. Imprecise but directionally correct for understanding channel mix. |
| Time-Decay | More credit to recent touchpoints. Works better for shorter sales cycles where recency matters. |
| Data-Driven (GA4) | Machine learning assigns credit based on actual conversion contribution. Now the Google Ads default. Best free option available. |
| Third-Party MTA | Advanced algorithmic models across all paid and organic channels. Highest accuracy. Required for PE-grade cross-channel budget decisions. |
For most PE-backed companies, the immediate priority is not a sophisticated third-party attribution platform. It is getting the foundations right: consistent UTM tagging, aligned attribution windows, offline conversion feedback loops, and a reconciled CAC calculation that marketing and finance both agree on.
Once those foundations are in place, layering in data-driven attribution through GA4 or a dedicated multi-touch tool produces a measurable ROI through better budget allocation decisions.
In 2023, Google officially removed last-click as the default attribution model and replaced it with data-driven attribution across Google Ads. That is an unambiguous signal from the largest advertising platform in the world. Most PE portfolio companies have not made the same transition.
What a Proper Attribution Audit Covers for a PE-Backed Company
An attribution audit is not a platform review or a metrics dashboard walk-through. It is a system-level investigation that maps the actual customer journey, compares what each platform reports, and traces discrepancies back to their root causes in the infrastructure.
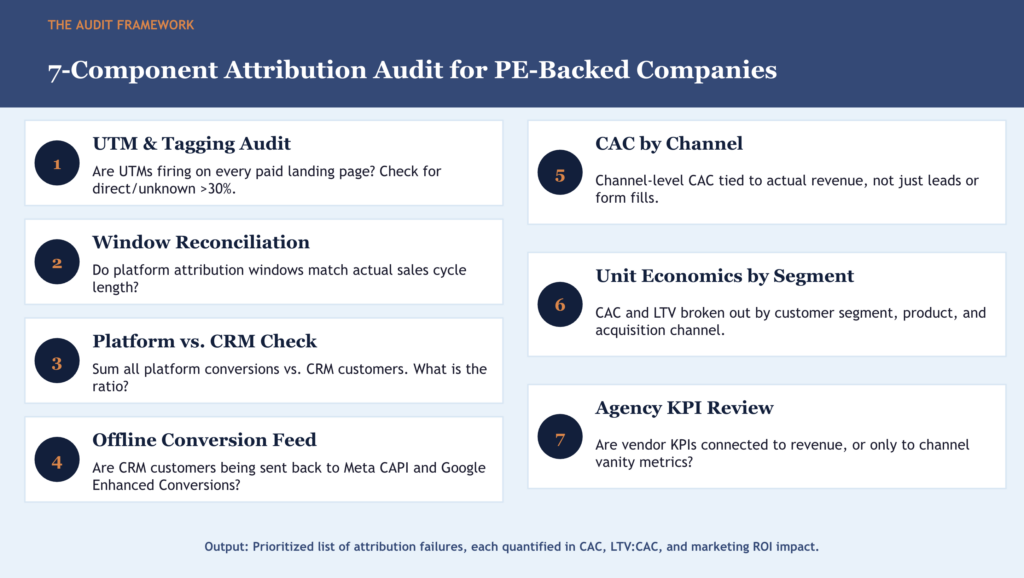
| Audit Component | What It Uncovers |
| UTM and Tagging Audit | Are UTM parameters firing on every paid landing page? What percentage of conversions arrive with no source data? |
| Attribution Window Reconciliation | Do platform attribution windows match the actual sales cycle? Are Meta, Google, and CRM windows aligned? |
| Platform vs. CRM Conversion Reconciliation | Sum all platform-reported conversions for a period. Compare to actual CRM customers. What is the ratio? |
| Offline Conversion Feed Review | Are CRM-confirmed customers being sent back to Meta CAPI and Google Enhanced Conversions for optimization? |
| CAC by Channel Calculation | Does the company have channel-level CAC tied to actual revenue, not just leads or form fills? |
| Unit Economics by Customer Segment | Is CAC and LTV calculated by customer segment? Different products and acquisition channels have very different economics. |
| Agency Accountability Review | Are vendor KPIs connected to revenue or only to channel-level vanity metrics? |
The output of a proper attribution audit is a prioritized list of infrastructure failures, each expressed in terms of its dollar impact on CAC, LTV:CAC ratio, and marketing ROI. The most high-value findings are the ones where a channel was cut or is being systematically underfunded because the measurement said it was not working.
Across our diagnostic engagements, the single most common finding is a performing channel that was effectively written off because last-click attribution gave it zero credit.
The revenue it had been generating was being credited to branded search. Cut the upper-funnel channel, and branded search performance declines two to three months later when the demand pipeline it was capturing runs dry.
How to Brief Operating Partners on Attribution Without Getting Technical
Operating partners do not need to understand UTM parameter architecture or conversion API configuration. They need a framework for recognizing when attribution is broken and the right questions to surface it.
PwC research on PE operating partner effectiveness found that the most impactful operating partners anchor portfolio company leadership to business outcomes, unit economics, and capital efficiency. Attribution is the measurement infrastructure that makes those conversations possible.
Here are five questions to ask every portfolio company marketing team:
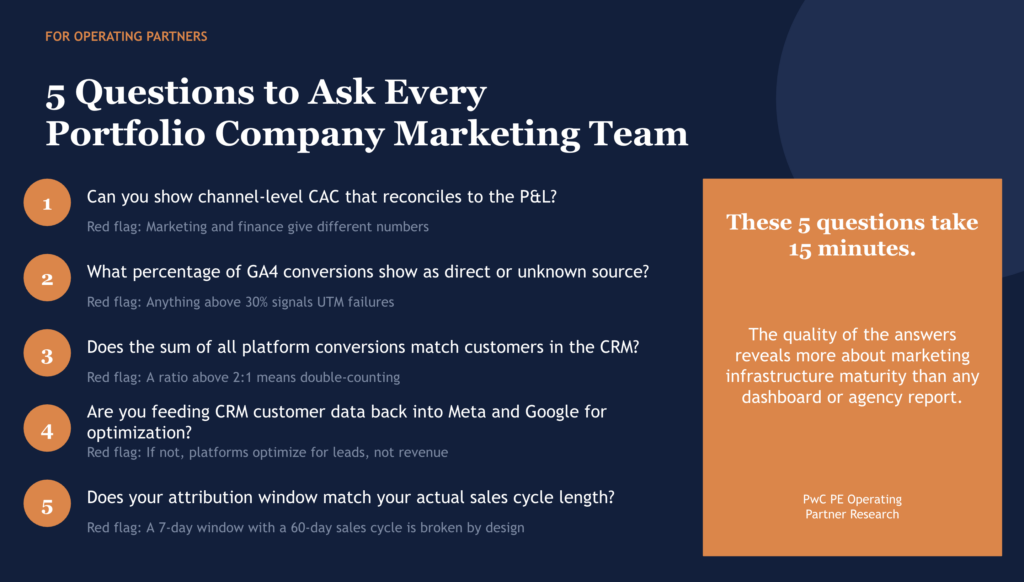
- Can you show me channel-level CAC that reconciles to the P&L? If marketing and finance have different CAC numbers, the attribution infrastructure is broken.
- What percentage of GA4 conversions show as direct or unknown? Anything above 30 percent signals UTM failures or tracking gaps.
- If you add up conversions across all ad platforms, does the total match customers in the CRM? A ratio above 2:1 means platforms are double-counting conversions.
- Are you sending CRM customer data back to Meta and Google for ad optimization? If not, platforms are optimizing for leads, not revenue.
- What attribution window does each platform use, and does it match your sales cycle length? A mismatch here is one of the most common sources of channel performance distortion.
These five questions can be asked in 15 minutes. The quality of the answers tells you more about marketing maturity than any reporting dashboard. McKinsey research on marketing measurement found that nearly three-quarters of CEOs believe marketing teams cannot explain how much incremental revenue their spend generates. Attribution is the infrastructure that makes that explanation possible. Without it, every channel decision is a guess.
The Strategic Layer Gap: Why Attribution Problems Persist
Attribution failures do not exist in isolation. They are symptoms of a broader condition that we call the Strategic Layer Gap: the absence of senior marketing leadership that connects execution activities to business outcomes.
Most PE-backed portfolio companies have marketing teams that execute. They manage campaigns, run agencies, publish content, and handle email. What they consistently lack is someone whose job is to look across all of that activity, connect it to revenue, and make cross-channel capital allocation decisions based on what is actually working.
When the Strategic Layer is absent, attribution failures persist because nobody owns the connection between channel activity and revenue outcomes. The Google Ads agency reports on Quality Scores.
The SEO agency reports on rankings. The email team reports on open rates. Nobody is asking which of these activities is producing customers at what CAC with what payback period, and nobody has the authority to reallocate budget across channels based on the answer.
For a portfolio company spending $3.85 million per year on marketing with no strategic oversight connecting spend to revenue, a 20 percent attribution-driven misallocation represents $770,000 in annual capital waste. That number compounds every quarter. It affects EBITDA. It affects multiple exits.
According to Bain’s PE value creation research, companies with structured commercial excellence programs, including marketing analytics, outperform peers by 27 percent in revenue growth. The fix is not more spend. It is a better measurement, and someone is accountable for acting on it.
Attribution Is the First Thing We Fix in Every Diagnostic
At Azarian Growth Agency, attribution diagnosis is part of every Strategic Growth Diagnostic we run for PE-backed companies. Not because we are a tracking tool vendor. Because we have never conducted a diagnostic where the marketing spend decisions were being made on clean, reliable attribution data. Not one.
In our diagnostic work, we go system-deep: direct access to CRM backends, ad platform accounts, GA4 property configurations, and email automation logic. We do not review dashboards. We look at what the dashboards are built on. What we find, consistently, is that the channels teams wrote off were actually working.
The channels absorbing the majority of the budget were capturing demand built by channels that had been cut. The CAC number the board was tracking was calculated differently by every executive in the room.
We have found attribution failures costing portfolio companies hundreds of thousands of dollars per year in misdirected spend. We have found lead flow configurations routing significant percentages of paid leads into dead queues with no follow-up and no visibility into the loss.
We have found ad platforms optimizing for lead volume while acquiring customers at negative unit economics because no one had connected revenue outcome data back into the bidding system.
These are not edge cases. They are the pattern. The Strategic Layer Gap that enables them exists at the majority of PE-backed companies we assess, and it persists because no single person in the organization owns the connection between marketing activity and business outcomes.
| What the Strategic Growth Diagnostic Covers Our diagnostic is a paid, independent, system-deep assessment that covers: – Full attribution chain audit: UTM integrity, window alignment, platform vs. CRM reconciliation – Unit economics analysis: CAC, LTV, and payback period calculated by channel and customer segment – CRM and lead flow audit: from ad click to first sales contact, tracing every break in the chain – Agency accountability review: are vendor KPIs connected to revenue or to channel vanity metrics – Cross-channel budget allocation analysis: where is spend going vs. where is revenue actually coming from? – 150 to 200-item prioritized roadmap with dollar-impact estimates and implementation timelines The diagnostic takes 4 to 8 weeks and converts to a Fractional CMO engagement in the majority of cases, because the complexity it reveals makes ongoing strategic leadership feel necessary rather than optional. Learn more about our Strategic Growth Diagnostic. |
Our last PE portfolio engagement began with the same sentence we hear repeatedly: “We are spending more on marketing than ever, and revenue is flat.” The attribution audit found multiple high-performing upper-funnel channels that had been cut based on last-click data showing near-zero ROAS. Those channels were reactivated.
The budget was reallocated based on actual contribution measurement. The company moved from the diagnostic to a Fractional CMO retainer within six weeks.
The fix was not more ad spend. It was knowing which spend was building demand and which was simply getting credit for demand built by a channel that had been eliminated.
| Your marketing budget deserves a measurement system that reflects how customers actually buy. If your ad platforms, CRM, and finance team are each reporting a different CAC, attribution is broken. We diagnose it, quantify the cost, and build the infrastructure to fix it. Let’s Talk Strategic Growth Diagnostic | Fractional CMO Services | PE Portfolio Support |
Resources
Attribution and Marketing Measurement
- eMarketer: 5 Key Stats on Last-Click Attribution Measurement (Primary industry sentiment data on last-click dissatisfaction and migration intent)
- Google: Data-Driven Attribution Delivers Better Results Than Last-Click (Case studies: Select Home Warranty, Medpex, H.I.S. Travel)
- Marketing Dive: Is Last-Click Attribution to Blame for Misallocation of Media Budgets? (Industry overview on attribution and budget waste)
- HEEET: Last-Touch vs. Multi-Touch Attribution: The Real Cost of Getting It Wrong (Practical single-touch attribution cost breakdown)
- KEO Marketing: Marketing Attribution Models Multi-Touch ROI Guide 2026 (Comprehensive model comparison with Forrester research synthesis)
- Ruler Analytics: Complete Guide to Multi-Touch Attribution (Model mechanics, implementation guidance, and ROI data)
- Funnel.io: Multi-Touch Attribution vs. Marketing Mix Modeling (When to use MTA, when to use MMM, and why the modern answer is both)
B2B Buyer Journey and Touchpoint
- HockeyStack Labs: B2B Customer Journey Touchpoints by Deal and Company Size (150-company study on touchpoint counts by deal size, ACV, and company revenue)
- McKinsey B2B Pulse Survey 2024 (10+ channel usage data; how B2B buying behavior has changed since 2016)
- Pathmonk: B2B Customer Journey Touchpoints (Average touchpoints by deal type, complexity, and industry)
PE Value Creation and Marketing Due Diligence
- PwC: How Private Equity Operating Partner Roles Are Changing (Operating partner functions and the shift toward operational value creation)
- Moonfare: Private Equity Value Creation Strategies and Examples (Bain research: structured commercial analytics programs drive 27% revenue uplift)
- Moving Minds: Pre and Post-Acquisition Marketing Due Diligence for Private Equity (What PE firms find in marketing DD and what they consistently miss)
- Boomn: The Ultimate Guide to Marketing Due Diligence for Private Equity Firms (Comprehensive PE marketing DD framework including attribution and unit economics)
Budget Waste and Data Quality
- Gartner 2025 CMO Spend Survey (Marketing budgets at 7.7% of revenue; CMO budget pressure data)
- Forrester: Why Marketers Cannot Ignore Data Quality ($1.2M to $16.5M annual losses from poor marketing data quality by company size)
- McKinsey: Measuring Marketing Global Survey Results (CEO perspective on marketing ROI proof; less than half of spend clearly allocated)
Attribution Tools and Implementation
- Google Ads Help: About Attribution Models (Official Google documentation on attribution model options and data-driven attribution mechanics)
- Rockerbox: How Marketing Teams Drove Better Outcomes in H2 2025 (Real-world multi-touch attribution outcomes and budget reallocation results)
- Measured: Why Incrementality Testing Is Better Than MTA or MMM Alone (Gold-standard measurement methodology with real-world enterprise example)
- Improvado: Best Multi-Touch Attribution Solutions 2026 (Comparison of 12 leading attribution platforms with use case guidance)