You work hard to attract customers—ads, emails, discounts, the whole nine yards.
But what happens after they buy? If they disappear, all that effort (and money) goes to waste.
The truth is, long-term success isn’t about how many customers you get—it’s about how many you keep.
A high retention rate means more repeat purchases, stronger brand loyalty, and lower marketing costs.
But here’s the catch: most businesses don’t track it properly or worse, ignore it altogether.
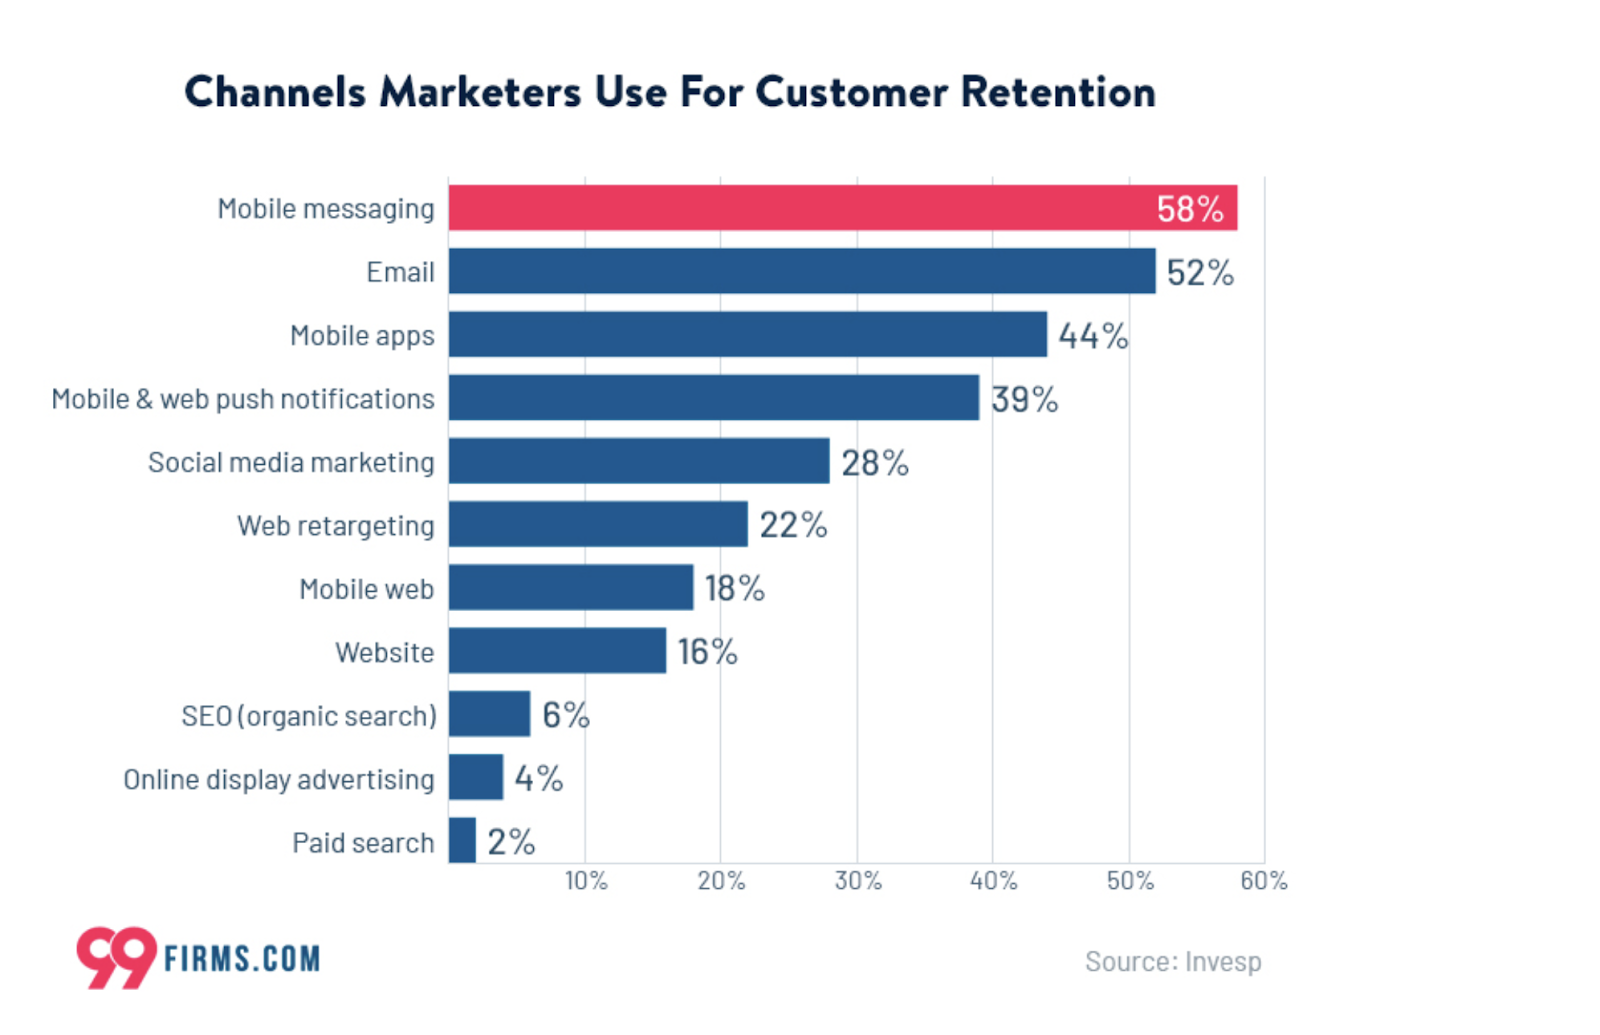
Source: 99 Firms
Customer retention isn’t a mystery. It’s a formula. And once you crack it, you can build a business that doesn’t just survive but thrives. Don’t forget to apply to the Retention Rate Calculator to have a more clear perspective.
This guide will show you how to calculate Retention Rates and build long-term customer relationships.
What Retention Rate Really Tells You (Beyond Just a Number)
Numbers don’t lie, and your retention rate is one of the most honest indicators of business health.
It answers key questions like:
- Are customers happy with your product or service?
- Do they see enough value to keep coming back?
- Is your business financially stable, or are you constantly replacing lost customers?
Retention Rate Predicts Profitability
The math is simple: The more customers you keep, the less you have to spend on acquiring new ones.
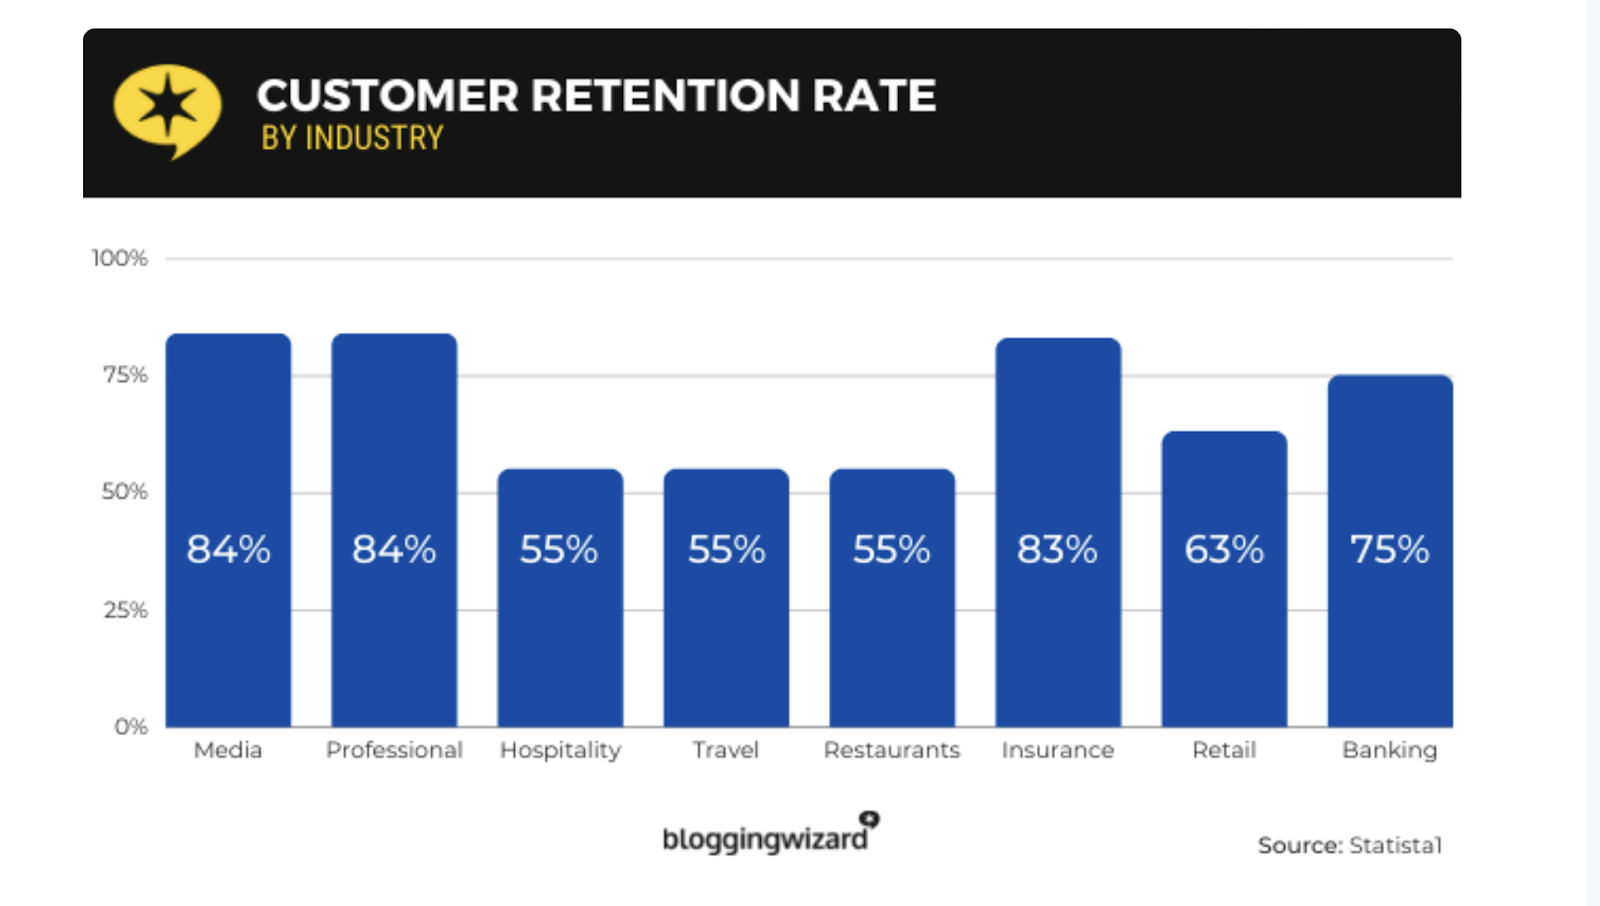
Source: Invespcro
Customer acquisition costs (CAC) are rising across all industries. For example:
- In SaaS, CAC has increased by over 50% in the last five years because of market saturation.
- In E-commerce, retaining an existing customer is 5 to 10 times cheaper than attracting a new one.
High retention compounds over time—long-term customers generate more revenue, require fewer marketing efforts, and often refer new customers.
Customer Retention Rate vs. Revenue Retention Rate
Not all retention metrics are created equal. Here’s the key difference:
- Customer Retention Rate (CRR): Measures the percentage of customers who stay over a given period.
- Revenue Retention Rate (NRR or GRR): Focuses on revenue retained, factoring in upsells, cross-sells, and churn.
For example, a SaaS company might lose 10% of its customers in a year but still increase revenue by 15% due to account expansions. That means customer retention is low, but revenue retention is strong.
Both metrics matter. If customer retention is dropping while revenue stays stable, it might mean only high-spending customers are sticking around.
That’s a red flag for long-term sustainability.
A High Retention Rate Means Strong Customer Satisfaction
Businesses with 80%+ retention rates typically have:
- Fast, efficient customer support (Think FinTech apps offering instant issue resolution).
- Consistent product value (Home service companies that maintain high service quality).
- Personalized engagement (E-commerce brands sending tailored recommendations).
Low retention? That’s often a sign of:
❌ Slow response times (Customers waiting days for help).
❌ Complicated onboarding (Users drop off before they see value).
❌ Lack of ongoing engagement (No follow-ups after purchase).
Retention is a mirror�—it reflects everything you’re doing right (or wrong) to keep customers happy.
The Simple Math of Retention (With a Twist)
Retention isn’t about guesswork.
There’s a formula behind it, and every business should know how to calculate retention rates correctly.
The Classic Retention Rate Formula (And How It Works)
The standard formula is:

Where:
- E = Customers at the end of a period
- N = New customers acquired during that period
- S = Customers at the start of the period
Example of A Home Services Business: A cleaning company starts the month with 500 customers. It gains 100 new customers but ends the month with 520 customers.
That means 16% of the company’s original customers didn’t book again.
The Retention Calculator: Your Secret Weapon
You could calculate retention manually every month, but why not let a tool do the work?
Why a Retention Rate Calculator Saves Time
✅ Eliminates human error (no more miscalculations)
✅ Provides instant insights (great for fast decision-making)
✅ Tracks trends over time (spot retention drops before they hurt revenue)
How to Use a Retention Calculator (Step-by-Step)
- Select the timeframe – Monthly, quarterly, or annually, depending on your industry.
- Enter starting customer count – How many customers did you begin with?
- Input new customers acquired – Remove them from retention calculations.
- Enter the end-of-period customer count – How many stayed?
- Let the calculator do the math!
Most tools also graph your retention over time, helping you visualize trends.
The Leaky Bucket Effect: Where Are You Losing Customers?
You spend time, effort, and money attracting new customers.
But then—without warning—they disappear.
Some leave quietly, others cancel subscriptions, and a few never come back after their first purchase.
It’s frustrating.
Why are they leaving? Where are you going wrong?
This is what’s known as the leaky bucket effect. No matter how much water (new customers) you pour in, leaks (customer churn) keep draining your business.
If you don’t find and fix those holes, you’ll always be running in place, trying to replace lost customers instead of growing your business.
So, where are the biggest leaks in your bucket? Let’s take a closer look.
The Hidden Holes in Your Customer Experience
Every business loses customers—it’s normal. But the question is, why are they leaving?
Often, it’s not because of one big issue. Instead, it’s a collection of small frustrations that slowly push customers away.
Poor Onboarding (The ‘First Impression’ Failure)
- Customers don’t fully understand how to use your product.
- They don’t see immediate value, so they lose interest.
- No one follows up to check if they need help.
Example: A SaaS company offering accounting software sees a 30% drop-off in new users after just one week. Why? Their setup process is too complex, and customers never reach the point where they see the software’s full benefits.
Fix It:
- Send a welcome email with a short tutorial.
- Offer live chat support during onboarding.
- Use behavior-based reminders to nudge users toward key actions.
Slow Response Times (Making Customers Wait Too Long)
Customers hate waiting—whether it’s for support, service, or answers.
If they don’t get help fast, they leave.
- In E-commerce, 75% of customers expect a response within 5 minutes.
- FinTech companies that take too long to resolve payment issues lose customer trust instantly.
- Home service businesses that don’t answer calls quickly miss potential bookings.
Example: A home repair company gets a lead from an online form but takes 48 hours to follow up. By then, the customer has already hired someone else.
Fix It:
- Offer chat support or automated follow-ups.
- Set up a response time goal (e.g., reply within 1 hour)
- Train your team to prioritize urgent requests.
Lack of Personalization (Treating Everyone the Same)
Customers want to feel valued—not like just another sale.
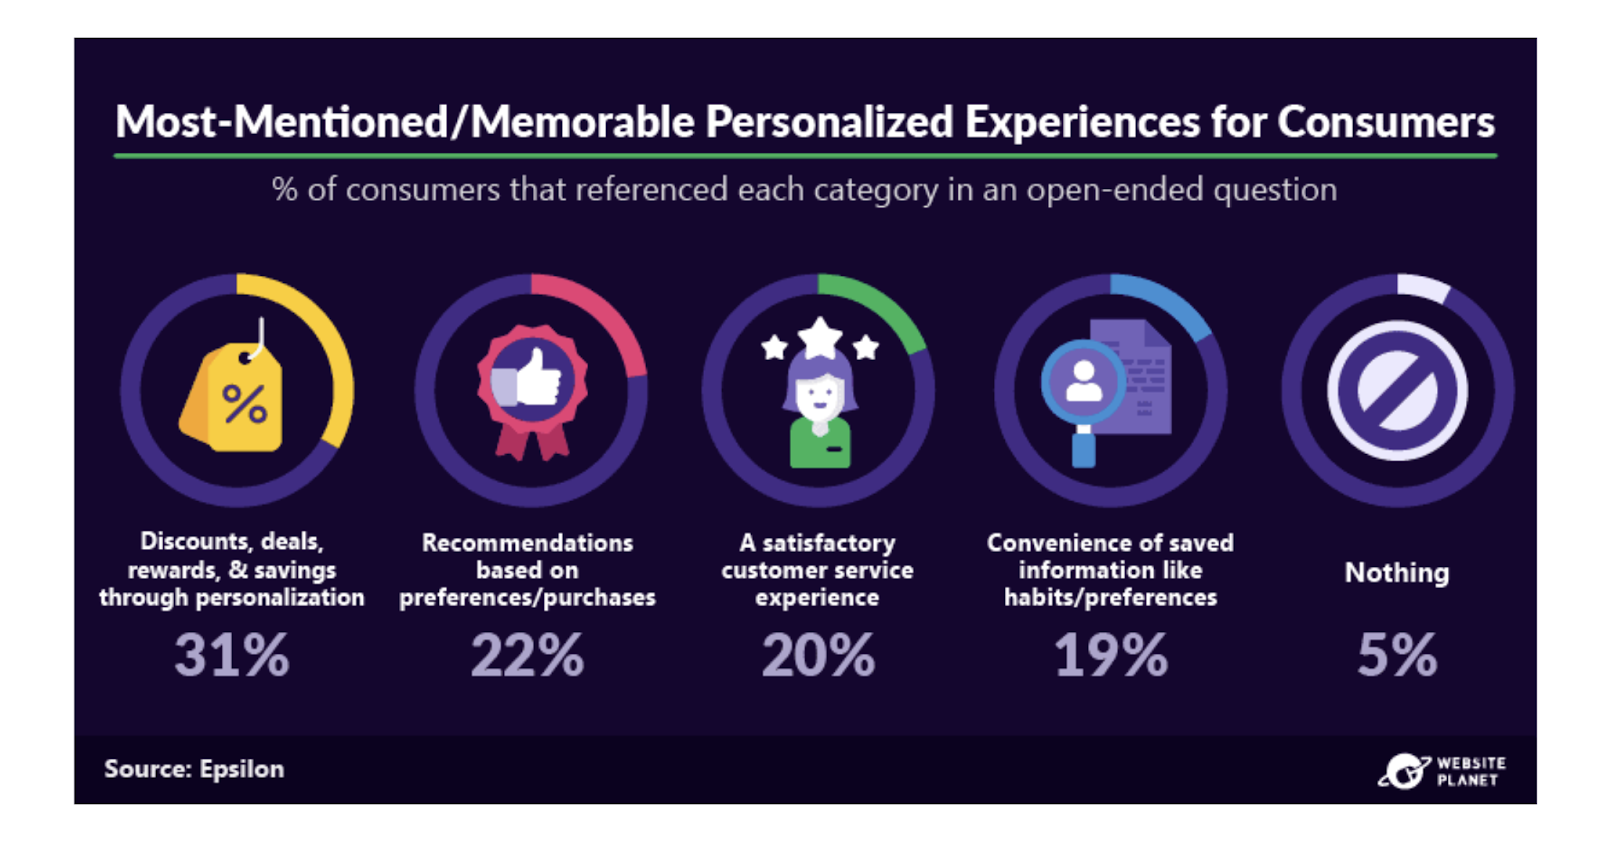
Source: Website planet
If they keep getting generic emails, irrelevant offers, or robotic services, they’ll find a business that treats them like an individual.
- SaaS customers are more likely to stick around if they receive product recommendations based on their usage.
- E-commerce buyers expect brands to remember their preferences and past purchases.
- FinTech users want real-time insights tailored to their financial behavior.
Example: A subscription box company keeps sending customers the same product categories, even after they’ve repeatedly skipped them. Eventually, they cancel because they feel unheard.
Fix It:
- Segment customers and send tailored offers.
- Use AI-driven recommendations to predict needs.
- Offer loyalty perks based on past behavior.
No Follow-Up After Purchase (Forgetting About Customers)
Many businesses work hard to get a customer but then stop engaging after the sale.
Customers start feeling like they were only valued before they paid.
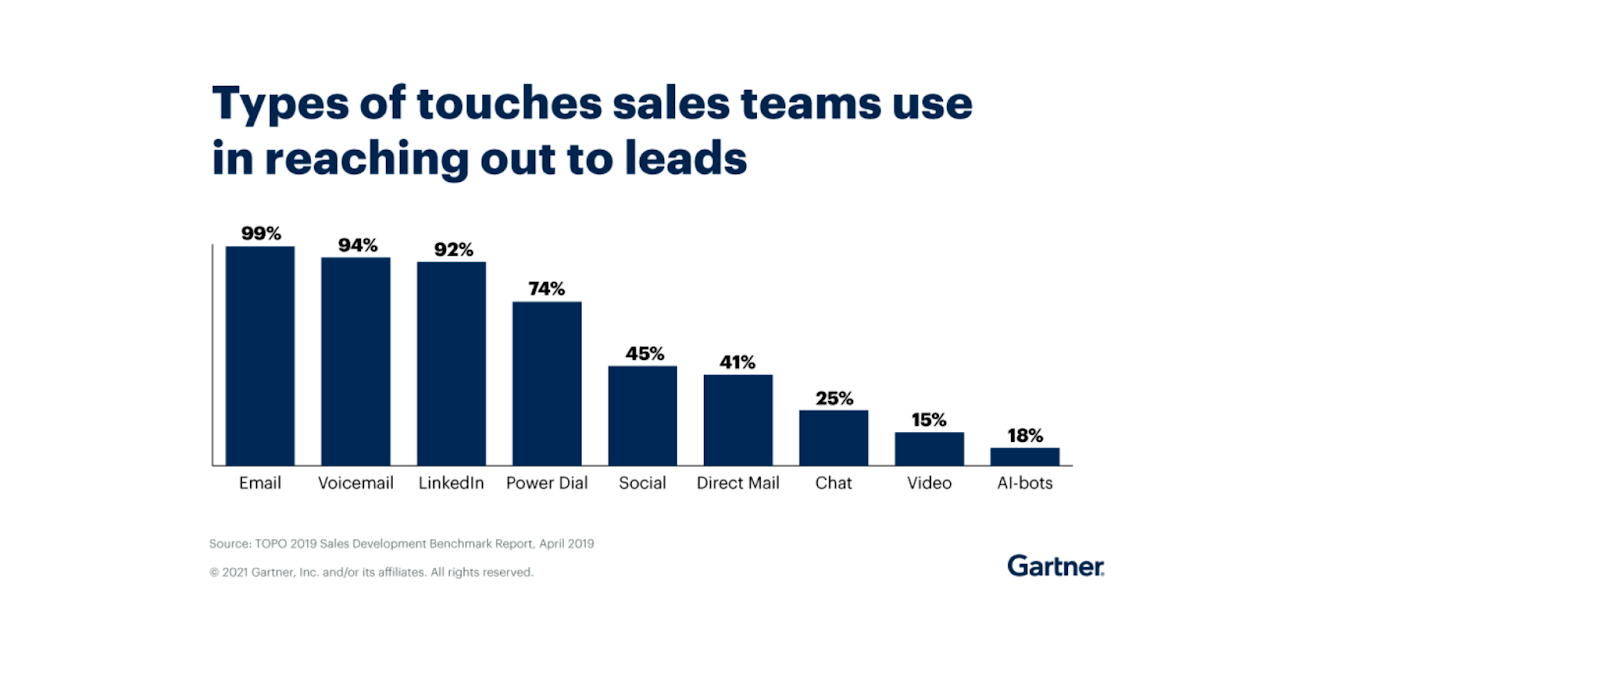
Source: Gartner
Example: A FinTech investment app gets new users through aggressive marketing. But after sign-up, users never get tips, updates, or check-ins. They stop using the app, forget about it, and eventually cancel.
Fix It:
- Send value-driven emails (how to get the most from your product).
- Offer exclusive deals for repeat purchases.
- Create a community or referral program to keep customers involved.
Churn vs. Retention: Why You Need to Track Both
Many businesses focus on how to calculate retention rates, but they ignore churn rate—the other half of the equation.
Simply put:
- Retention rate tells you how many customers stay.
- Churn rate tells you how many customers leave.
They’re direct opposites—when one goes up, the other goes down.
The Churn Rate Formula (How to Calculate It)
To measure how fast customers are leaving, use this formula:

Example: A SaaS company starts the month with 1,000 customers. By the end of the month, they have 950 customers.

That means 5% of customers left in one month.
Revenue Churn Rate (Because Not All Customers Are Equal)
If you sell subscription-based services (like SaaS or FinTech), it’s not just about how many customers leave—it’s about how much revenue you’re losing.
Formula:
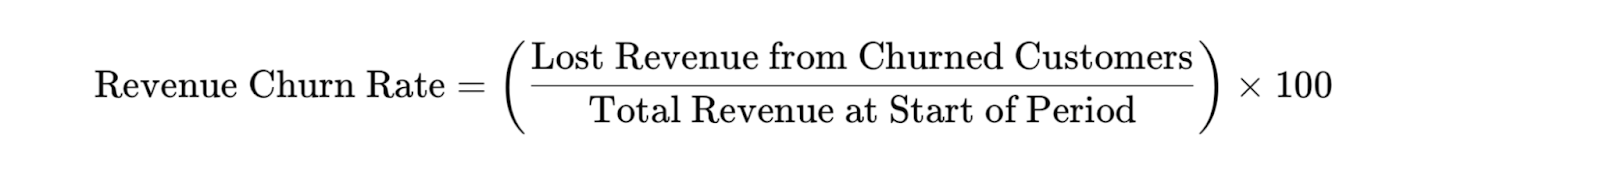
Example: A subscription-based FinTech platform has $500,000 in monthly recurring revenue (MRR). During the month, they lose $25,000 in churned subscriptions.

A high revenue churn rate means you’re losing your most valuable customers—not just any customers.
Why Tracking Both Churn & Retention Gives a Full Picture
If you only track the retention rate, you might miss the real problem.
Example:
- A SaaS company retains 90% of its users (high retention rate).
- However, 50% of its premium users cancel (high revenue churn).
- That means the company is keeping low-value users but losing the big spenders.
By tracking both customer retention rate and churn rate, businesses can see:
- Who is leaving? (Are low-value or high-value customers churning?)
- When are they leaving? (Right after sign-up? After 6 months?)
- Why are they leaving? (Pricing, competition, poor support?)
Keep Customers, Keep Growing: Retention is Your Business’s Best Bet
Losing customers isn’t just frustrating—it’s expensive. You can keep pouring money into ads, discounts, and promotions, but if your retention rate is low, it’s like filling a bucket with holes.
[A] Growth Agency is there for you. We don’t just focus on getting you new customers—we help you keep them.
From tracking the right retention metrics to building personalized engagement strategies, we make sure your customers stay longer, spend more, and become loyal advocates for your brand.
Growth isn’t just what we offer; it’s who we are.
Let’s stop the leaks and build a business that grows sustainably.
Get in touch today and start turning first-time buyers into lifelong customers.