
You’re in the quarterly marketing review. Your team pulls up three screens.
Google Ads reports 47 conversions this month. Meta reports 39. GA4 shows 28. Your CRM has 19 actual leads. You spent $80,000 to get here, and nobody in the room can tell you which number to believe.
This is not a reporting problem. It is a structural problem. And it has a direct dollar cost.
According to Gartner, poor data quality costs organizations an average of $12.9 million per year. Most of that damage is invisible; it shows up in misallocated budgets, channels written off that were actually working, and customers never contacted because a system said they were unqualified.
The platforms are not broken. They are not lying. They are each measuring success using different rules. The problem is that nobody ever told you which rules apply to which decision, and which dashboard number to actually act on.
This article gives you that framework.
Why the Numbers Never Match: The Three Root Causes
Before you can trust any number, you need to understand why the same marketing activity produces different counts in different systems. There are three structural reasons.
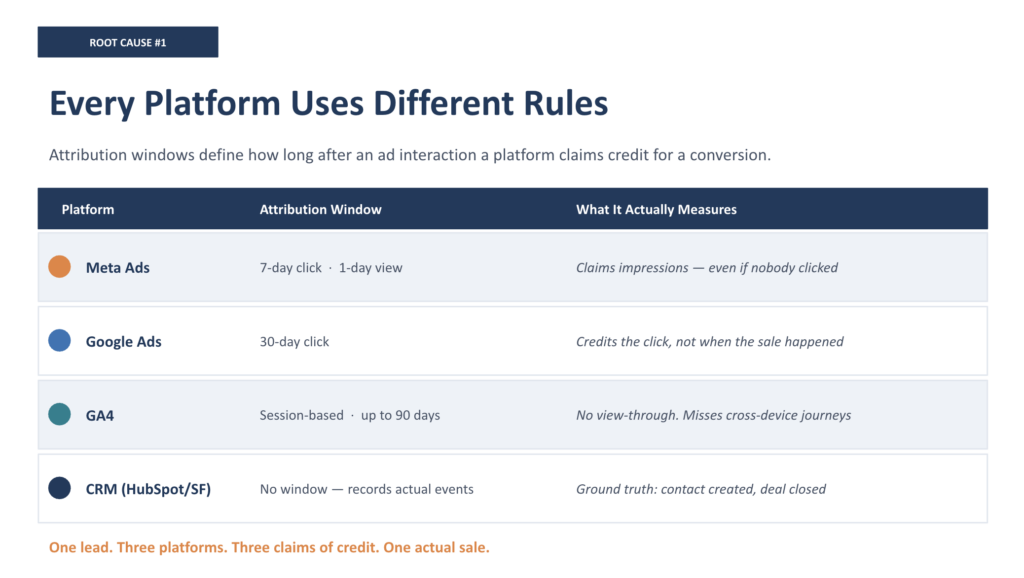
1. Attribution Windows: Every Platform Plays by Different Rules
Attribution windows define how long after an ad interaction a platform will claim credit for a conversion. The defaults are wildly inconsistent:
| Platform | Default Click Window | What It Means |
| Meta Ads | 7-day click, 1-day view | Claims credit for anyone who saw your ad in the last 24 hours, even if they never clicked |
| Google Ads | 30-day click | Credits the ad click for any conversion within 30 days, regardless of other touchpoints |
| GA4 | Session-based / up to 90 days | Only counts clicks, not views. Uses data-driven attribution across sessions |
| CRM (HubSpot/Salesforce) | No window limit | Records the actual event: a contact created, a deal opened, a sale closed |
The practical result: a single lead who saw a Meta ad on Tuesday, clicked a Google ad on Thursday, and converted on Friday via a direct visit can be counted as a conversion by all three platforms simultaneously. Meta claims it (view window). Google claims it (click window). GA4 attributes it to Direct because the last session had no UTM tag. Your CRM records it as one lead.
The math problem: When you add up what each ad platform reports, you often get 150–200% of your actual conversions. According to Cometly’s attribution research, double-counting across overlapping attribution windows is the single most common cause of inflated platform reporting.
2. Counting Methodology: Each System Measures a Different Thing
Beyond attribution windows, each tool is counting fundamentally different objects:
- GA4 counts sessions, events, and users, as well as behavioral signals. It fires a JavaScript tag in your visitor’s browser. If they have an ad blocker, the tag never fires. According to Backlinko’s ad blocker research, 31.5% of global internet users block ads or trackers , which means GA4 structurally undercounts every session and conversion on your site.
- Ad platforms count interactions tied to ad exposures , clicks, views, and downstream events , attributed back to the ad that started the journey.
- Your CRM counts contacts created, deals opened, and revenue closed. It records what actually happened in your business, not what a pixel inferred.
Three different objects. Three different counts. None of them wrong. All of them incomplete on their own.
3. The UTM Problem: Direct Traffic Is Lying to You
“Direct traffic” in GA4 is supposed to mean people who typed your URL directly into a browser. In practice, it is GA4’s catch-all category for “I don’t know where this person came from.”
Here is what actually ends up in your direct traffic bucket:
- Links shared via email, Slack, WhatsApp, or LinkedIn DMs, where referrer data is stripped before the click
- Paid ad links where UTM parameters were never added, were stripped by a redirect, or failed to survive a mobile app’s in-app browser
- Sessions that timed out (after 30 minutes) and restarted without the original UTM tag
- Clicks from AI-generated summaries, research from Loamly found that roughly 70% of traffic from AI tools like ChatGPT arrives as “Direct” in GA4
A practitioner benchmark: if your direct traffic exceeds 20% of total site traffic, something is broken in your tracking. According to experts at Analytics Mania, the healthy range is 5–20%. Above that threshold, paid and organic channels are being systematically under-credited, and you are making budget decisions on data that misrepresents what is actually driving your growth.
The Data Source Hierarchy: Which Number to Trust for Which Decision
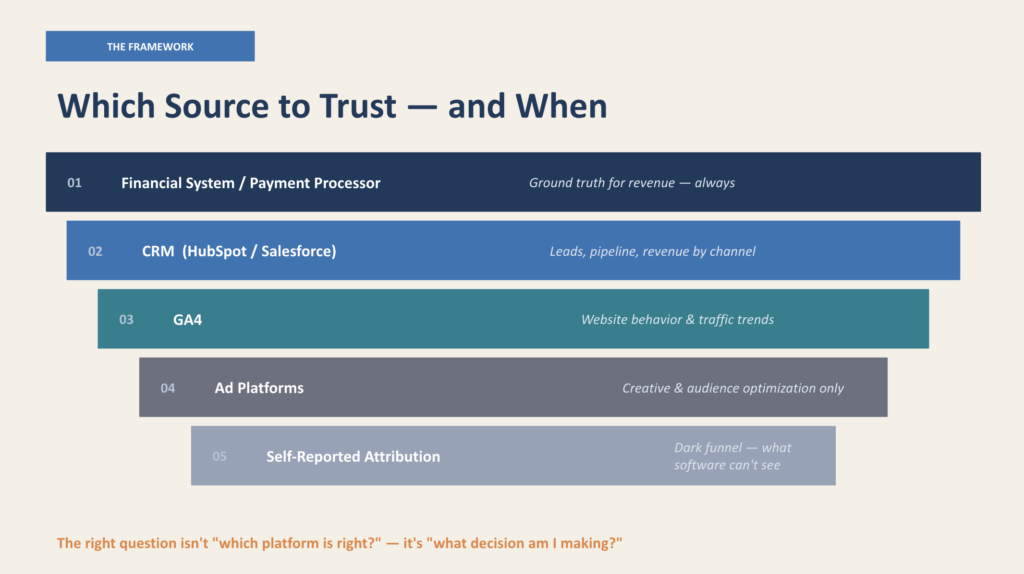
This is the framework nobody gives you. The right question is not “which platform is right?” It is “what decision am I trying to make?” Each source has authority over specific business questions , and using the wrong source for the wrong decision produces expensive mistakes.
| Decision You’re Making | Source to Trust |
| How much revenue did marketing generate? | CRM / financial system, the only source connecting marketing activity to actual closed revenue |
| Which channel should get more budget? | Blended ROAS: total revenue from CRM ÷ total spend across all channels. No single platform tells the truth here. |
| Is this channel driving traffic and engagement? | GA4, for directional trends, journey behavior, and cross-channel comparison (not absolute conversion counts) |
| What is our actual cost to acquire a customer? | CRM, for lead quality, close rate by source, and revenue per channel |
| Which ad creative or audience performs best? | Ad platform native data, the one context where platform reporting is definitely the best source |
| Why is our direct traffic so high? | UTM audit + server-side tracking diagnosis, a tracking infrastructure problem, not a traffic source |
A more direct version of this hierarchy:
- Financial system / payment processor → ground truth for revenue
- CRM (HubSpot / Salesforce) → source of truth for leads, pipeline, and revenue attribution by channel
- GA4 → source of truth for website behavior, traffic trends, and cross-channel patterns
- Ad platforms → source of truth only for within-platform optimization: creative, audience, bidding
- Self-reported attribution (post-form “how did you hear about us?”) → essential complement revealing touchpoints invisible to software
The insight most executives miss:
“The only number that is 100% accurate is the money in your bank account.” The CRM is the closest proxy to that. Every other dashboard is measuring something upstream of actual revenue , and the further upstream you get, the more methodology distortion you introduce.
The Decision Tree: If GA4 Says X and the CRM Says Y, Then…
QUICK DIAGNOSTIC FRAMEWORK
Use this framework when your dashboard numbers conflict. The goal is not to find which platform is “right”; it is to determine whether the discrepancy is structural (expected and acceptable) or symptomatic (indicating a real tracking problem).
Scenario 1: Ad platform conversions are 2–3x higher than CRM leads
- Likely cause: Attribution window overlap, both Google and Meta are claiming the same conversions.
- What to check: Pull both platforms for the same date range. Sum their reported conversions. Divide by CRM leads. Ratio above 1.5x confirms double-counting.
- Action: Stop making budget decisions from ad platform totals. Use Blended ROAS (CRM revenue ÷ total spend) as your true performance metric.
- This is structural, not broken. Expected variance of 20–50% between platforms and CRM is normal per industry benchmarks.
Scenario 2: GA4 shows fewer conversions than CRM
- Likely cause: Ad blockers suppressing GA4 tracking, or UTM tags failing to pass through forms into the CRM.
- What to check: What percentage of your audience is tech-savvy (higher ad blocker rates)? Is your direct traffic above 20%?
- Action: Implement server-side tracking. According to TAGGRS server-side tracking research, server-side implementations recover 5–30% of previously untracked conversions.
- This may be a real problem; investigate if GA4 undercount vs. CRM exceeds 20%.
Scenario 3: A channel shows strong ad platform metrics but almost no leads in the CRM
- Likely cause: UTM parameters not passing through to the CRM, or offline conversions not being imported back to the ad platform.
- What to check: Open 10 recent CRM leads. What is their recorded lead source? If most show “Direct” or “Unknown,” UTM tracking is broken.
- Action: Implement UTM capture in your form submission flow. Connect CRM to ad platforms via Google Enhanced Conversions and Meta Conversions API (CAPI). This closes the feedback loop, so platforms optimize for actual customers, not just form fills.
- This is almost always a real problem, not normal variance.
Scenario 4: GA4 direct traffic is suspiciously high (above 20%)
- Likely cause: UTM stripping in redirects, email clients, or mobile app in-app browsers. Or paid campaigns running without UTM tags.
- What to check: Pull a sample of 20–30 recent leads and trace their source. Check your paid campaign URLs; are UTMs applied consistently and correctly?
- Action: Standardize UTM naming conventions (always lowercase). Audit all campaign URLs monthly. Use a UTM builder with dropdown controls to prevent drift.
- Rule of thumb: every 10 percentage points of unexplained direct traffic represents paid and organic channels being systematically under-credited.
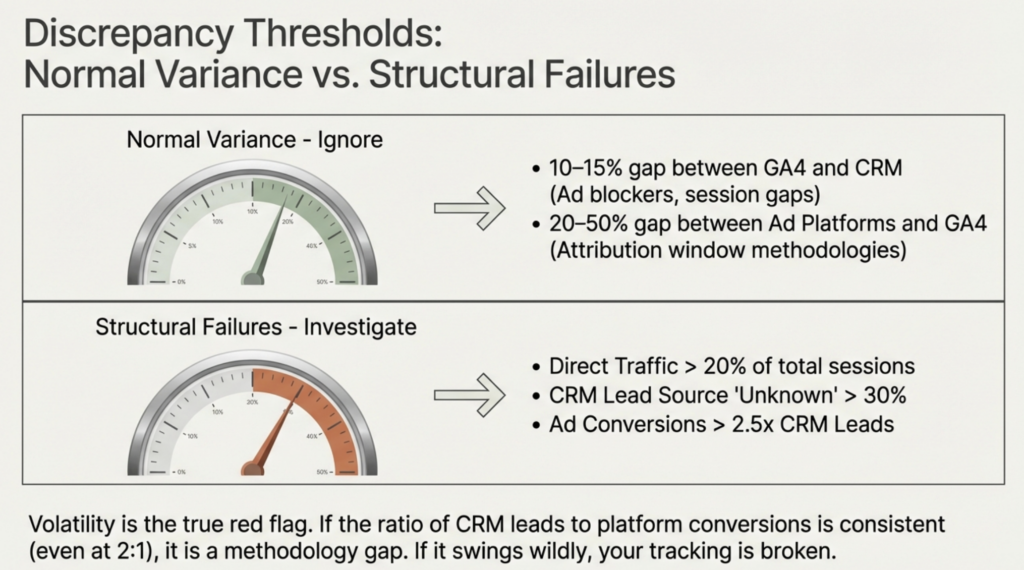
When Discrepancy Is Normal vs. When It Signals a Real Problem
Not every number mismatch requires immediate action. Here is the distinction:
Normal variance, expected and acceptable
- 10–15% difference between GA4 and CRM conversion counts (ad blockers, session gaps, form abandonment after GA4 fires)
- 20–50% difference between ad platform totals and GA4 (attribution window methodology, view-through vs. click-through counting)
- Meta reporting 15–20% more conversions than GA4 (iOS privacy changes, Aggregated Event Measurement modeling)
- Google Ads reporting higher than GA4 (cross-device attribution, Google has logged-in user data that GA4 cannot access)
Real problems, investigate immediately
- Direct traffic above 20% of total sessions, UTM tracking failure, not actual behavior
- CRM lead source showing “Direct” or “Unknown” for more than 30% of leads, paid channels are generating leads that your CRM cannot attribute to any campaign
- Ad platform conversions are more than 2.5x CRM leads; extreme double-counting suggests attribution windows have never been reviewed
- GA4 reporting fewer conversions than CRM on the same event, client-side tracking being blocked at scale
- Any metric that goes to zero or drops 80%+ overnight, tracking code likely broken (not a channel problem)
The diagnostic standard we use: Pull any channel’s CRM-attributed leads and compare to that platform’s reported conversions for the same 90-day period. If the ratio is consistent month over month, even if it’s 2:1, that is a methodology gap, not a tracking error. If the ratio is volatile (1.2x one month, 3.8x the next), something structural is broken and needs to be diagnosed.
The Fix: Building One Source of Truth
“One source of truth” is a phrase most agencies use loosely. Here is what it actually means in practice: a reconciled data layer that pulls the right information from each system for the right decision.
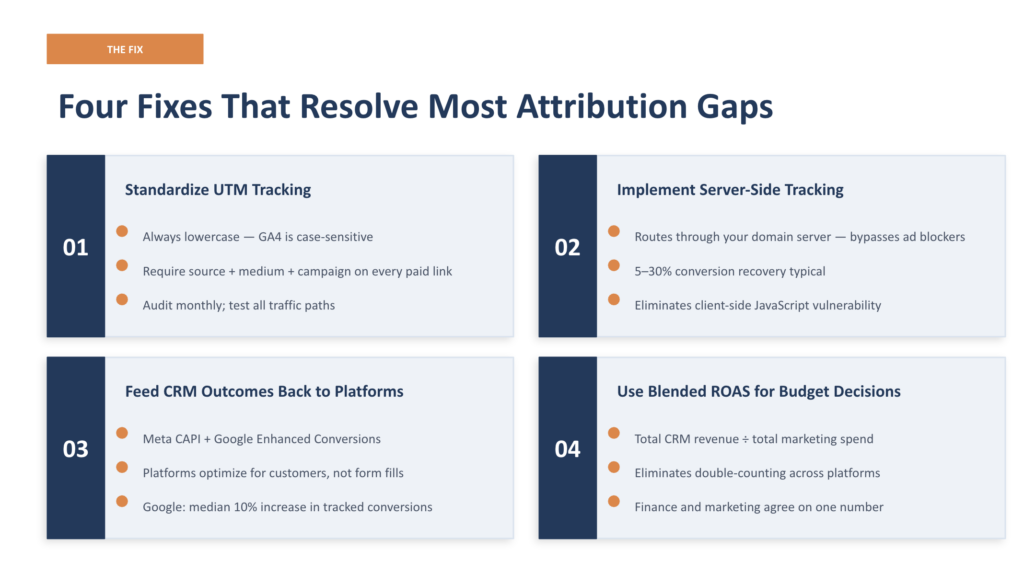
Four foundational fixes that resolve the majority of attribution discrepancies:
Fix 1: Standardize UTM tracking across every campaign
- Always use lowercase (GA4 treats ‘Facebook’ and ‘facebook’ as different sources)
- Require utm_source, utm_medium, and utm_campaign on every paid link
- Audit campaigns monthly, naming drift compounds quickly across teams and agencies
- Test all major traffic paths: email clients, social app link clicks, and paid ad final URLs
Fix 2: Implement server-side tracking
Client-side JavaScript tracking is blocked by ad blockers, iOS privacy features, and browser restrictions. Server-side tracking routes data collection through your own domain server before sending to third parties. The practical result: 5–30% of conversions that were disappearing from your data are recovered.
Fix 3: Feed CRM outcomes back to ad platforms
Right now, your ad platforms optimize for form fills. They have no idea which of those form fills became paying customers. Connecting your CRM to ad platforms via Google Enhanced Conversions and Meta’s Conversions API sends actual customer outcomes back to the platforms, shifting their optimization from volume to revenue. Google reports that advertisers feeding CRM data back via Enhanced Conversions see a median 10% increase in tracked conversions.
Fix 4: Stop using ad platform totals for budget allocation
Use Blended ROAS as your performance benchmark: total revenue from CRM, divided by total marketing spend across all channels. This eliminates double-counting and gives you a single denominator that finance and marketing can agree on.
What We Find When We Actually Look
The discrepancies described above are not edge cases. We find them in almost every company we assess, and the financial impact is significant.
In a recent engagement at a financial services portfolio company, a system-deep diagnostic revealed that the majority of paid search leads were being created in the CRM with an incorrect default lifecycle stage, meaning they never entered any nurture workflow and were never contacted by the sales team. The fix took under an hour. The revenue impact of the gap had been accumulating for months.
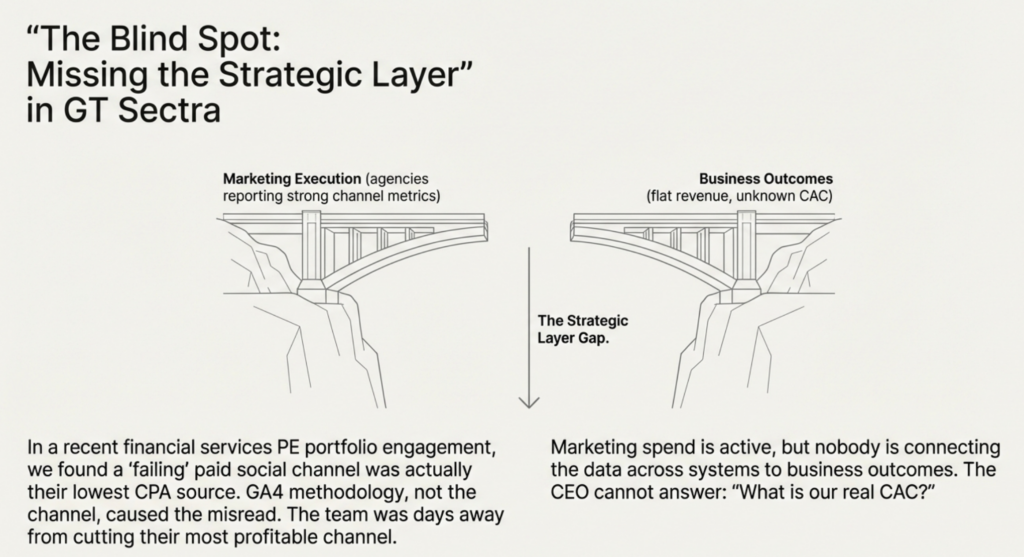
In the same engagement, a paid social channel had been written off as ineffective based on GA4 data. When we traced the attribution chain, the channel was actually performing among the lowest cost-per-acquisition sources in the portfolio. The tracking methodology, not the channel, had caused the misread. The team was about to eliminate the budget from their best channel.
These are not unusual findings. They are the predictable result of what happens when three platforms each report using different rules, and nobody has a strategic layer connecting those reports to actual business outcomes.
According to Nielsen’s 2024 Annual Marketing Report, 84% of marketers report confidence in their ROI measurement, yet only 38% actually evaluate marketing holistically across channels. The confidence is high. The measurement is incomplete.
We call this the strategic layer gap: marketing spend is active, teams are executing, agencies are reporting , but nobody is connecting the data across systems to business outcomes. The CEO cannot answer “what is our real CAC?” The CFO does not trust the marketing numbers. The board asks hard questions that nobody can answer with confidence.
What a Strategic Growth Diagnostic Finds
Azarian Growth Agency runs paid, independent Strategic Growth Diagnostics for PE-backed portfolio companies and growth-stage businesses. Over 4–8 weeks, we go system-deep across seven assessment areas: channel performance, attribution infrastructure, unit economics, email and lifecycle, competitive intelligence, organizational capability, and technology stack.
We do not hand over a deck and walk away. We diagnose what is broken, build the prioritized roadmap, and stay to execute it. The diagnostic is designed to make the findings undeniable and the path forward clear.
What we typically uncover:
- Attribution chains broken at the CRM level, causing leads to be created in the wrong lifecycle stage and never receive follow-up, not a campaign problem, a configuration problem
- Direct traffic inflated above 30% due to missing UTM tags on active paid campaigns; every dollar spent on those campaigns is invisible in the data
- Ad spend is concentrated on customer segments with negative unit economics, while high-value segments are systematically underfunded, because nobody connected marketing spend to margin by segment
- Agencies reporting strong channel metrics while revenue stays flat, because agency KPIs were never connected to CAC, LTV, or payback period
The diagnostic is not a free audit. Free audits are sales pitches with different packaging. We charge for independence because independence requires not having a financial stake in any particular finding.
If your team cannot agree on what your CAC is, or if your ad platforms show one story and your CRM shows another, that is not a reporting problem. It is a strategic layer problem. And it is costing you money every month it goes unresolved.
We find what others miss. Then we stay to fix it.
Ready to find out what your marketing data is actually telling you?
Talk to our growth experts about a Strategic Growth Diagnostic.
Resources
DATA SOURCES
- Gartner: How to Stop Data Quality Undermining Your Business – Research on the $12.9M average annual cost of poor data quality
- Nielsen 2024 Annual Marketing Report – Global survey of 2,000+ marketers on ROI confidence and measurement gaps
- Imperva/Thales 2025 Bad Bot Report – Bot traffic data showing automated traffic now exceeds human web traffic
- Backlinko: Ad Blocker Statistics 2026 – Global ad blocker usage rates and demographic breakdown
- Analytic Partners: Data Doesn’t Lie, But Marketing Metrics Can Mislead – ROI Genome research on siloed analytics overstatement
- Enleaf: GA4 vs PPC vs Last-Click Attribution, Why Numbers Differ – Practitioner breakdown of expected variance ranges between platforms
- Adverity: Analysts Don’t Trust the Data That Drives Marketing Decisions – Survey of 964 marketers and data professionals on data trust gaps
PLATFORM DOCUMENTATION & TECHNICAL REFERENCES
- Google Ads: About Conversion Windows – Official documentation on Google Ads attribution window defaults
- Analytics Mania: UTM Parameters Not Working in GA4 – Diagnostic guide for UTM tracking failures
- Analytics Mania: What is Direct Traffic in GA4 and How to Fix It – Practical guide to diagnosing and reducing inflated direct traffic
- Bounteous: GA4 Attribution Issues Explained – Breakdown of (not set), Unassigned, and other GA4 attribution anomalies
- TAGGRS: Server-Side Tracking Benefits – Case study data on conversion recovery from server-side implementation
- Stape.io: Meta Conversions API Explained – How CAPI works, and how to implement it alongside pixel tracking
- Cometly: Why Ad Platform Reporting Doesn’t Match – Platform-specific reasons for conversion count discrepancies