Community-led growth (CLG) contributes directly to revenue, retention, and overall customer value.
It influences how people discover products, make buying decisions, and stay engaged long after the sale.
To measure this impact, you need more than activity counts or sentiment scores. You need to understand how community drives conversions, renewals, and upsells.
That’s what community-attributed revenue helps uncover: real business value tied to community actions.
The Attribution Challenge: Why 73% of Businesses Can’t Prove Community ROI
Most companies invest in community, but 73% can’t show the return. The problem is weak attribution and shallow metrics. Tracking member count or post volume doesn’t explain how the community drives revenue.
Executives want proof. They expect to see an impact on sales, retention, or lifetime value. Without that, budgets are harder to justify.
Many teams struggle to link engagement to outcomes. Poor tracking slows growth and limits investment.
Companies that measure community-attributed revenue have an edge. They can prove value, focus on what works, and scale faster.
It starts by defining what to track and how to tie it to revenue.
Defining Community-Attributed Revenue: Beyond Vanity Metrics
Community-attributed revenue is the portion of revenue that can be linked to community interactions, behaviors, or influence across the customer journey. It’s how businesses connect community activity to real outcomes like sales, upsells, or retention.
This isn’t about counting likes or comments. It’s about tracking how community touchpoints impact pipeline and revenue over time.
Direct vs Indirect Attribution
Direct attribution happens when a sale, signup, or upgrade comes directly from a community action. That could include a member referral, a product purchase from a discussion thread, or a lead sourced from a webinar hosted inside the community.
Indirect attribution is more complex. It includes assisted conversions, brand influence, product feedback, and customer education. These activities may not trigger an immediate sale, but they shorten sales cycles, reduce churn, or improve customer value.
Both types matter. Focusing only on direct conversions underestimates the full value of the community.
Revenue Categories to Track
To measure accurately, split community-attributed revenue into clear categories:
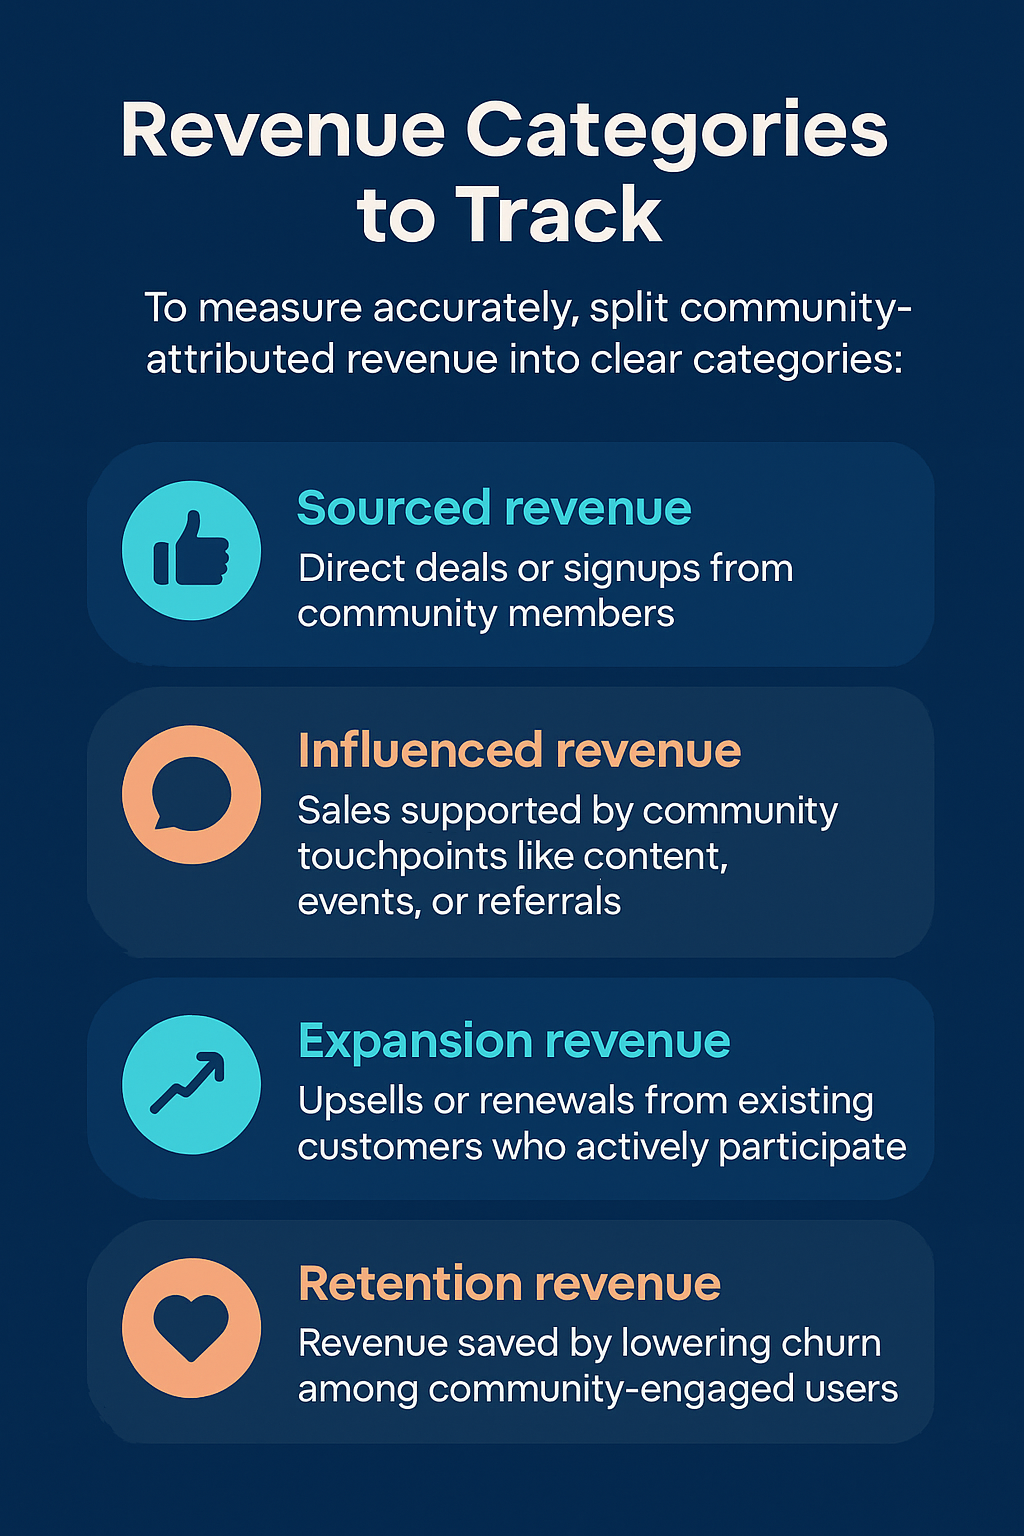
- Sourced revenue: Direct deals or signups from community members
- Influenced revenue: Sales supported by community touchpoints like content, events, or referrals
- Expansion revenue: Upsells or renewals from existing customers who actively participate
- Retention revenue: Revenue saved by lowering churn among community-engaged users
Each tells a different story. Together, they give a full view of how the community contributes to growth.
Key Measurement Principles
A strong attribution model follows these principles:
- Consistency: Use clear rules for tracking and categorizing revenue
- Multi-channel awareness: Capture how the community works alongside other channels like paid media or sales
- Time-based tracking: Look at how community actions influence revenue over weeks or months.
- CRM integration: Tie community data to your sales system so attribution flows into actual pipeline reports
Measuring community impact isn’t about finding one perfect number. It’s about building a system that tracks influence clearly, consistently, and at scale.
The 3-Layer Attribution Framework
To measure community-attributed revenue accurately, you need a clear structure.
At Azarian Growth Agency, we use a 3-layer attribution framework. It breaks down community impact into direct, influence-based, and retention-driven revenue.
Each layer reflects how the community contributes at different points in the customer lifecycle.
Together, they give you a full view of how value flows from community engagement to business results.
Layer 1: Direct Revenue Attribution
This is the most straightforward. It tracks revenue that comes directly from the community.
This layer captures revenue that comes directly from community actions. It’s the easiest to measure and often the first place to start.
Key examples include:
- Community-sourced sales: Leads that come directly from community discussions or events.
- Member purchases: Transactions from logged-in users on your platform.
- Upgrade tracking: Customers who upgrade plans after participating in community Q&As, AMAs, or product threads.
- Referral revenue: Purchases made through tracked referral links or member-shared codes.
To track this, use:
- UTM-tagged links in community platforms
- Referral programs tied to CRM or marketing automation
- Form tracking connected to lead sources in your CRM
This data shows how the community drives direct pipeline contribution.
Layer 2: Influence-Based Attribution
This layer tracks assisted conversions and multi-touch journeys. It focuses on deals where the community influenced the decision, but didn’t create or close the lead directly.
Measurement tactics include:
- Assisted conversions: Community activity appears between initial awareness and closed won.
- Touchpoint analysis: Mapping how often leads interact with community posts, content, or events.
- Multi-channel attribution: Assigning partial value to community alongside email, paid ads, or sales outreach.
- Community influence scoring: Scoring leads based on meaningful community actions, such as repeat visits or topic engagement.
This requires deeper integration between:
- Your community platform
- Web and behavior analytics
- CRM and campaign data
This layer shows that the community contributes directly to the buying journey, not only to brand visibility.
Layer 3: Retention and Expansion Attribution
The third layer measures how the community supports current customers. This is where long-term value shows up clearly.
Track:
- Churn reduction value: Compare churn rates between community-active customers and non-members.
- Upsell attribution: Identify expansion revenue linked to community engagement, such as attending a product webinar or joining a feature discussion.
- Lifetime value improvement: Measure the increase in average contract value among community-engaged accounts.
- Retention coefficient: Calculate the difference in renewal rates between engaged and unengaged cohorts.
This data often lives across CS platforms, billing systems, and product analytics. Combine it with CRM data to show how the community lowers churn and grows account value.
Setting Up Your Attribution Infrastructure
To measure community-attributed revenue, you need a solid infrastructure. This means choosing the right tools, connecting your data, and tracking the right actions. It also means building clear dashboards that reflect business outcomes.
1. Select the Right Tools
Start by identifying the platforms you already use. Then fill in any gaps based on what you need to track.
- Community platforms like Orbit, Common Room, or Discourse help capture engagement data.
- CRM and marketing tools like Salesforce, HubSpot, or Marketo track leads, contacts, and revenue outcomes.
- Analytics platforms like GA4, Segment, or Mixpanel track behavior across channels.
Make sure your tools support integrations and data export. Attribution depends on connected systems.
2. Integrate Your Data
Once you’ve chosen your tools, connect them. Attribution fails when data lives in silos.
Integrate:
- Community activity into CRM profiles
- CRM records into your analytics tools
- Campaign, product, and event data into a central reporting layer
You can use middleware tools like Segment or Zapier to move data between systems. The goal is to track every touchpoint on the journey, from the first community interaction to the revenue event.
3. Implement Tracking
Next, set up consistent tracking across all platforms. Start with:
- UTM parameters to label community links
- Referral codes tied to member accounts or activity
- Custom events that track content views, clicks, or participation
Define what qualifies as a community-driven action. Then log it in your CRM or analytics system in a way that connects to pipeline and revenue.
4. Build Dashboards That Show Business Impact
Data only matters when it’s visible and useful. Build dashboards that report:
- Revenue from community-sourced leads
- Deals influenced by community activity
- Expansion revenue from active members
- Churn rates by engagement level
Use tools like Looker, Tableau, or native CRM dashboards. Keep the focus on outcomes that matter to your leadership team (revenue, retention, and customer growth).
With the right tools and structure in place, you can move from engagement tracking to clear revenue reporting.
Key Metrics and Calculations for Community Revenue
Once the infrastructure is in place, it’s time to track what matters. Community-attributed revenue becomes meaningful when you tie it to real business performance. That starts with clear KPIs and consistent calculations.
Here are the core metrics every team should monitor.
1. Community-Sourced Revenue
This shows how much revenue originated directly from community interactions.
Formula:
Revenue from leads sourced through the community platform
Track leads with UTM tags, referral links, or CRM lead source fields marked as “Community.”
Benchmark:
Top-performing B2B communities source up to 15% of net-new revenue directly.
2. Community-Influenced Revenue
This tracks revenue where the community plays a supporting role in the sales cycle.
Formula:
Sum of deals with at least one community touchpoint during the buyer journey
Use multi-touch attribution tools to credit partial value to those interactions.
Benchmark:
Only 27% of companies currently measure community-influenced pipeline.
3. Expansion Revenue from Engaged Accounts
This metric reflects upsells or cross-sells tied to active community participation.
Formula:
Expansion revenue from existing customers active in the community
Link customer IDs from your CRM to engagement data in platforms like Orbit or Common Room.
Benchmark:
SaaS businesses consider a general expansion revenue rate of 10-30% as indicative of good and steady growth.
4. Retention Impact (Churn Reduction)
Community often reduces churn. Track retention among community participants vs. non-participants.
Formula:
(Renewal rate of community-active accounts) – (Renewal rate of inactive accounts)
Also, calculate the Retention Coefficient:
Renewal revenue from engaged users ÷ total renewal revenue
Benchmark:
Organizations implementing Salesforce Customer Communities experienced a 28.3% decrease in annual churn.
5. Customer Lifetime Value (CLTV)
Measure how the community impacts the long-term value of a customer.
Formula:
Average revenue per customer × average customer lifespan (in months or years)
Compare the CLTV of community-engaged customers vs. the rest of your base.
Benchmark:
In B2B SaaS, the average Customer Lifetime Value is approximately $240,000, highlighting the long-term impact of sustained customer engagement.
Reporting Frameworks That Work
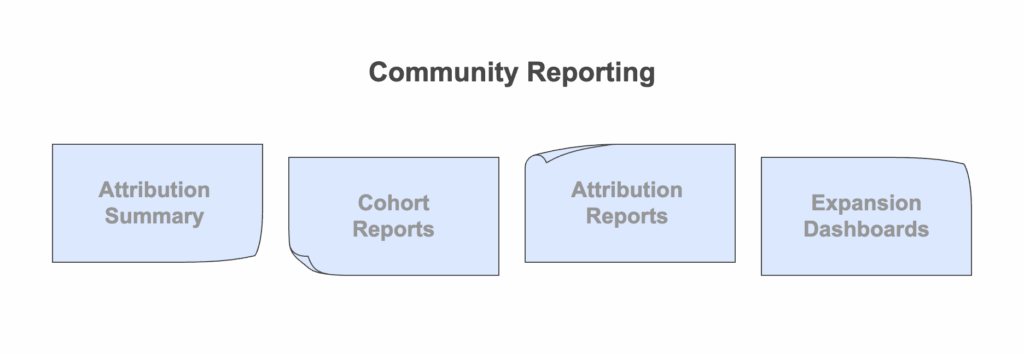
Executives want to see outcomes, not activity. Use these formats to report consistently:
- Attribution Summary Table
Break down sourced, influenced, and retention-based revenue. Include deal counts, percentages, and trendlines. - Community vs. Non-Community Cohort Reports
Compare CLTV, churn, and upsell rates between engaged and unengaged users. - Quarterly Attribution Reports
Align with business review cycles. Show revenue shifts linked to specific campaigns or engagement surges. - Retention and Expansion Dashboards
Display renewal rates, NRR, and feature adoption by community segment.
Keep all reporting aligned with executive priorities: growth, cost efficiency, and customer value.
Advanced Attribution: Modeling Indirect Community Value
Not all community impact shows up in clicks or CRM fields. But brand trust, visibility, and influence still drive revenue behind the scenes.
Brand Awareness Attribution
Community activity boosts visibility through social mentions, backlinks, and shares.
Track:
- Branded search growth
- Direct traffic trends
- “Community” as a lead source
These metrics show rising top-of-funnel awareness.
Word-of-Mouth Tracking
Referrals and private recommendations drive sales, especially in B2B.
To track it:
- Use referral codes
- Add community as a source in forms
- Ask buyers how they heard about you
Member advocacy lowers acquisition cost and builds credibility.
Community-Driven Content Value
User-generated content builds trust and supports the sales cycle.
Measure it by:
- Engagement on community content
- Including it in attribution models
- Feedback from sales teams
It’s cost-effective and often outperforms brand-created content.
SEO Impact
Community content ranks well (under SEO Impact) and brings long-term organic traffic.
Watch for:
- Traffic to the forum or community pages
- Keyword rankings from discussions
- Leads from search landing on threads
This boosts visibility and reduces reliance on paid ads.
Presenting Community ROI to Executives
You’ve got the data. Now make it resonate with leadership. CFOs and CEOs want impact, not anecdotes. Want real-world examples of how SaaS leaders report community ROI? Tune into the [A] Growth Ventures Podcast for interviews with founders and CMOs scaling community-led growth.
Use Executive Reporting Frameworks
Build clear dashboards tied to business KPIs. Focus on:
- Community-sourced revenue
- Influenced pipeline
- Retention and LTV lift
- Support cost savings
- Referral and organic growth
Report quarterly and benchmark against other channels.
Build a Business Case
Skip the story. Lead with facts that leaders care about:
- “Renewal rates are 14% higher in the community cohort.”
- “122 qualified leads came from discussions.”
- “CAC drops 17% with community touchpoints”
Use real data from your CRM and analytics tools.
Tie ROI to Budget
Show return against spend. Example:
$100K in spend → $380K in revenue + $40K in savings
Break down:
- Platform and tools
- Headcount or agency
- Event or content costs
Compare ROI with email, paid search, or other growth levers.
Forecast Future Value
Executives invest in potential. Use trends to project:
- More leads from referrals
- Upsell growth
- Long-term retention lift
- Organic traffic from community content
Show that the best returns are still ahead.
Turn Your Community Into a Proven Growth Channel with [A] Growth Agency
Measuring community impact shouldn’t be a guessing game.
At [A] Growth Agency, we help SaaS brands build, track, and scale community-led growth strategies that deliver measurable results.
From setting up your attribution infrastructure to reporting ROI to your executive team, we turn engagement into revenue you can see and share.
Ready to prove your community’s value and grow faster because of it?