
The Operator’s View | ICP 4B: PE-Backed Portfolio Company CFO | Problem Awareness
The number on your marketing dashboard is almost certainly wrong. Not because anyone invented it, but because marketing teams and finance teams define customer acquisition cost using completely different inputs. One team is optimizing campaigns. The other needs to model working capital. The two calculations answer different questions, and almost no one in the building flags the gap.
The version marketing reports as CAC is typically a media spend figure: paid ad budget divided by new customers in a period. It is clean, auditable at the campaign level, and routinely understates the true cost of acquisition by 30 to 60 percent once personnel, tooling, and overhead enter the picture.
For a CFO at a PE-backed portfolio company, this gap has a direct downstream effect. The unit economics your board is using to approve acquisition investment, set growth targets, and model runway may be built on a figure that would not pass a basic cost accounting review. The LTV:CAC ratios look stronger than they are. The payback period looks shorter. The capital required to sustain growth looks smaller.
This post translates CAC into finance language, identifies the three things marketing typically omits from acquisition cost reporting, shows you how to reconstruct the fully loaded number from your own general ledger, and connects CAC to the unit economics calculations that actually inform capital allocation decisions.
The number marketing calls CAC is almost never the number finance should use to evaluate capital efficiency. The gap is structural, not intentional.
CAC in Finance Terms: The Definition Marketing Skips
Customer acquisition cost is the total expenditure required to convert a prospect into a paying customer. Every dollar spent on sales, marketing, and the operations that support those functions, attributable to that conversion, belongs in the calculation.
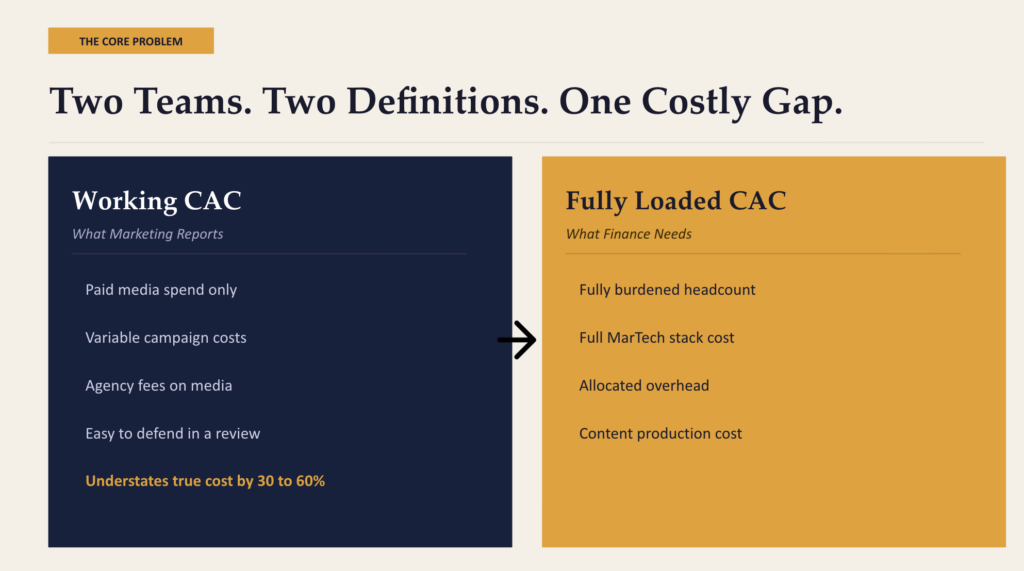
In practice, two versions of CAC circulate simultaneously. Marketing teams work with what practitioners call Working CAC: direct media spend and variable campaign costs divided by new customers in a given period. Finance teams need Fully Loaded CAC, which is the version a GAAP-aligned cost accounting methodology would produce if you applied to customer acquisition the same rigor you apply to cost of goods sold.
Brian Balfour, former VP of Growth at HubSpot, writing with Andrew Chen, captured the standard precisely: fully loaded CAC must include salaries of everyone working on marketing and sales, not just direct contributors but also managers spending fractional time on those functions, overhead allocated to those employees, and the full cost of the tooling stack. Most CAC figures presented to boards include none of these.
| Working CAC (What Marketing Reports) | Fully Loaded CAC (What Finance Needs) |
| Paid media spend | Paid media spend |
| Variable campaign costs | All S&M headcount: salary, commission, benefits, payroll tax |
| Agency media fees | MarTech stack: CRM, MAP, SEO tools, analytics, outreach |
| Not included: headcount | Allocated overhead: rent, IT, admin support |
| Not included: MarTech tools | Content production at full labor and production cost |
| Not included: overhead | Event, trade show, and field sales costs |
| Result: understated by 30 to 60% | Result: true acquisition cost for capital modeling |
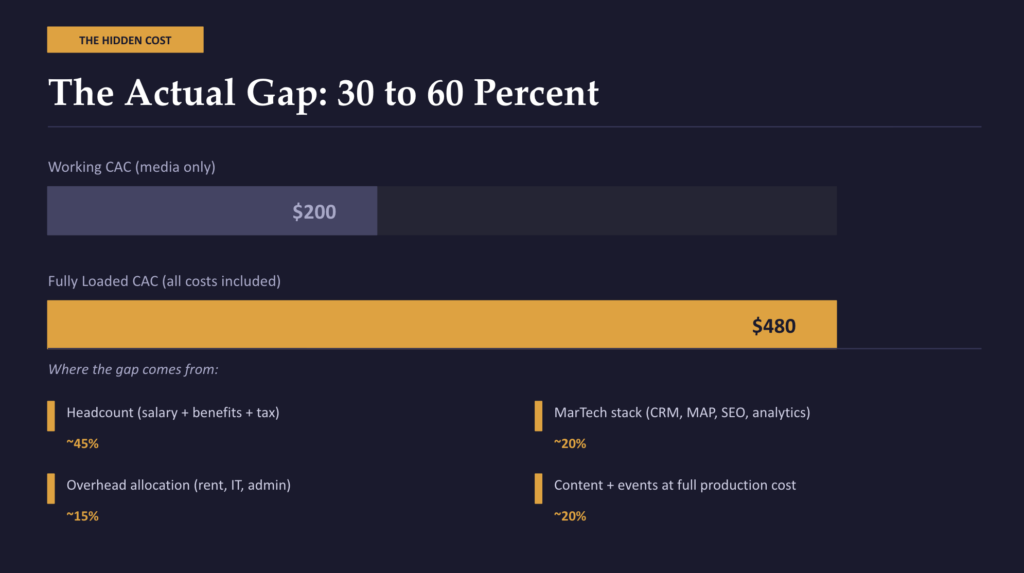
The gap between the two is not marginal. A B2B SaaS company with a $200 Working CAC can carry a Fully Loaded CAC above $500 once personnel and overhead enter the calculation. The LTV to CAC ratio, the payback period, and the growth efficiency multiple all shift materially depending on which figure is used as the input.
Marketing is not misreporting. Working CAC is the right tool for managing campaign performance. It is the wrong tool for modeling unit economics, evaluating acquisition investment at the portfolio level, or building a board-ready view of capital efficiency.
3 Things Marketing Routinely Omits from CAC Reports
These are structural omissions, not deliberate ones. Marketing teams are optimizing toward metrics that help them run campaigns more efficiently. The result is a CAC figure that reflects campaign cost, not acquisition cost. Here is where the gap most consistently appears.
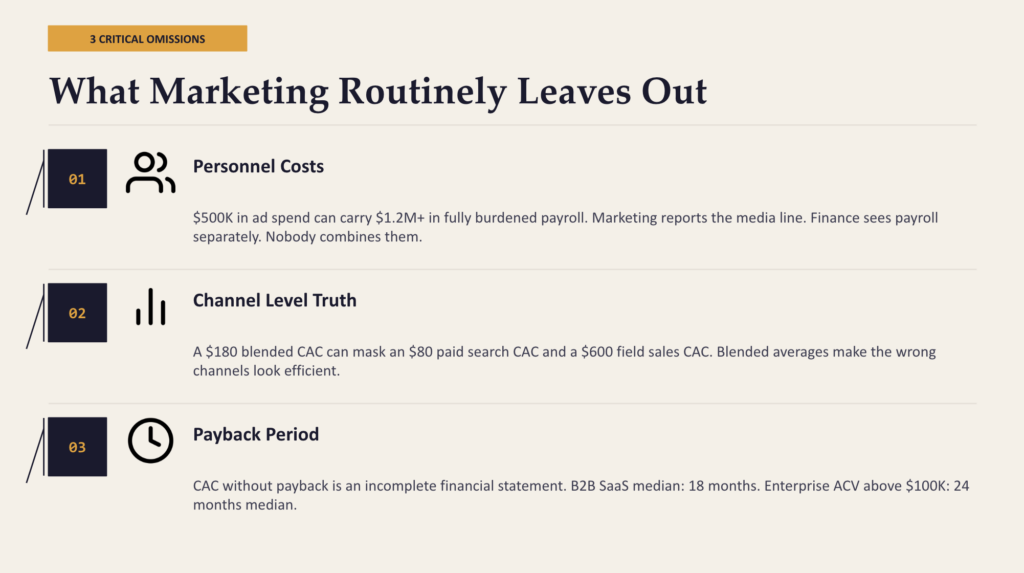
1. Personnel Costs: The Largest Single Gap
The single largest distance between Working CAC and Fully Loaded CAC is headcount. A marketing team running $500,000 in annual paid media may carry $1.2 million or more in fully burdened payroll: demand generation managers, content leads, SEO specialists, campaign analysts, and a VP whose time is split across marketing, strategy, and reporting to the board.
None of this appears in the standard CAC figure marketing presents. Marketing reports the media line. Finance sees the payroll separately in the P&L. The two are never combined into a single acquisition cost calculation unless someone builds it deliberately. In most PE-backed portfolio companies, no one does.
The same logic applies to the sales function. A business development representative carrying 200 new accounts per year has a fully burdened cost, including base salary, variable compensation, benefits, and employer payroll taxes, that should be allocated per acquisition. In many B2B businesses, fully burdened sales headcount alone adds $150 to $400 to the per-customer acquisition cost before a single dollar of media spend is counted.
A marketing team running $500,000 in paid media may carry $1.2 million in fully burdened payroll. The board sees the media number. Nobody presents the total.
2. Blended CAC Presented as Channel-Level Truth
Marketing teams typically report one CAC figure: total spend divided by total new customers. This blended number conceals the actual economics of individual acquisition channels and produces capital allocation decisions based on averages that do not reflect the true cost of scaling any specific channel.
A company generating 1,000 new customers per month might report a $180 blended CAC. That average can mask a paid search channel running at $80 per customer and a field sales channel running at $600 per customer. If the board approves the budget to double customer acquisition volume, the allocation decision needs to be channel-specific. Applying the blended figure to both channels produces the wrong answer for both.
The same distortion appears at the customer segment level. Enterprise accounts and SMB accounts carry vastly different acquisition costs in most B2B businesses. A company presenting blended CAC to a board evaluating an enterprise expansion investment is asking that board to approve a capital decision with an averaged figure that systematically underrepresents the economics of the specific motion being funded.
3. The Payback Period Is Missing Entirely
CAC without a corresponding payback period calculation is an incomplete financial picture. Marketing reports the cost number. The question of how long the business is cash-flow negative on each customer relationship before the acquisition investment is recovered is treated, in most portfolio companies, as someone else’s problem.
In a B2B context, this matters significantly. The CAC payback period for B2B SaaS companies sat at a median of 18 months in 2024, according to Benchmarkit’s SaaS Performance Metrics Report. Enterprise-focused companies with annual contract values above $100,000 ran at a 24-month median. That means the business is cash-flow negative on the customer relationship for two years before the acquisition cost has been recovered.
At a portfolio company adding 50 new enterprise accounts per year at a $600 Fully Loaded CAC and a 24-month payback period, roughly $1.8 million in unrecovered acquisition cost sits on the balance sheet at any given time. That figure represents a capital requirement the business is carrying that does not appear in the CAC number marketing reports. Without the payback calculation, neither the marketing team nor the board has a complete picture of the capital burden that growth is generating.
How to Calculate Your True CAC Without Asking Marketing
You do not need the marketing team’s attribution model to reconstruct a Fully Loaded CAC. You need your general ledger and your HR data. Both are already in your systems.
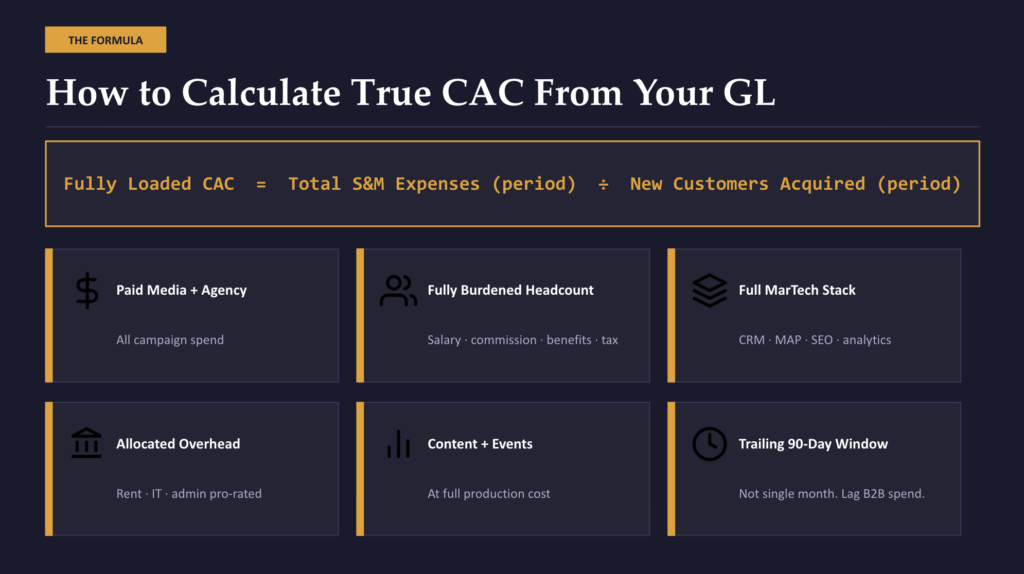
| THE FULLY LOADED CAC FORMULA Fully Loaded CAC = Total S&M Expenses (period) / New Customers Acquired (period) Total S&M Expenses includes all of the following: + All paid media, agency, and direct campaign spend + Fully burdened headcount for all marketing and sales roles (base salary + variable comp + benefits + employer payroll tax) + Full MarTech stack cost: CRM, marketing automation, SEO tools, analytics, outreach tools + Allocated overhead: office space, IT, and administrative support pro-rated to S&M + Content production at full labor and production cost + Event, trade show, and field marketing costs + Free trial or pre-conversion demo costs (for SaaS businesses) Period note: Use a trailing 90-day or 6-month window, not a single calendar month. In B2B, spend and conversion are rarely simultaneous. A single-month denominator distorts CAC significantly when there is a 60 to 120-day gap between investment and close. |
A few practical notes on applying the calculation:
- Use a lagged measurement window. In B2B sales cycles, there is typically a 60 to 120-day gap between when acquisition spend is incurred and when the customer closes. Dividing March spend by March new customers produces a CAC figure that overstates cost in months with heavy campaign spend and understates it when campaigns run ahead of the conversion period. A rolling 90-day or two-quarter window smooths this distortion.
- Separate the new logo from the expansion revenue. Upsell and renewal activity consumes sales and marketing resources, but should not be allocated to new customer CAC. If your sales team spends 40 percent of its time on expansion and renewals, allocate 60 percent of their fully burdened cost to new customer acquisition. Running the two together overstates CAC for new logo acquisition and obscures the true cost of growth.
- Apply overhead allocation consistently. GAAP cost accounting already allocates facilities, IT, and administrative overhead to functional areas. Apply the same methodology to your S&M cost center. If S&M headcount represents 25 percent of total employees, allocate 25 percent of shared overhead into the CAC calculation.
- Run channel-level CAC when CRM data allows. If your CRM tracks acquisition source, apply channel-specific spend to channel-specific new customers. The channel-level result tells you where the next marginal dollar of acquisition investment will actually produce a return. It is the number that makes budget allocation decisions defensible.
This calculation requires no new system. It requires pulling total S&M expense from the GL, total new customers from the CRM, and running a straightforward division. For most PE-backed portfolio companies, the analytical work takes less than a day.
How CAC Connects to LTV, Payback Period, and Contribution Margin
CAC by itself is a cost input. It tells you how much you spent. It does not tell you whether the spend was justified, whether the business recovered the investment, or what each customer is actually worth to the P&L. Three additional calculations are required to convert CAC into a financial statement.
LTV:CAC Ratio: Are You Investing or Spending?
The LTV to CAC ratio measures whether the long-run value of a customer exceeds the cost to acquire them, and by what multiple. The standard benchmark for PE-backed and venture-backed B2B businesses is a minimum of 3:1, with 4:1 now increasingly cited as the revised baseline following years of rising acquisition costs in most SaaS categories.
The formula:
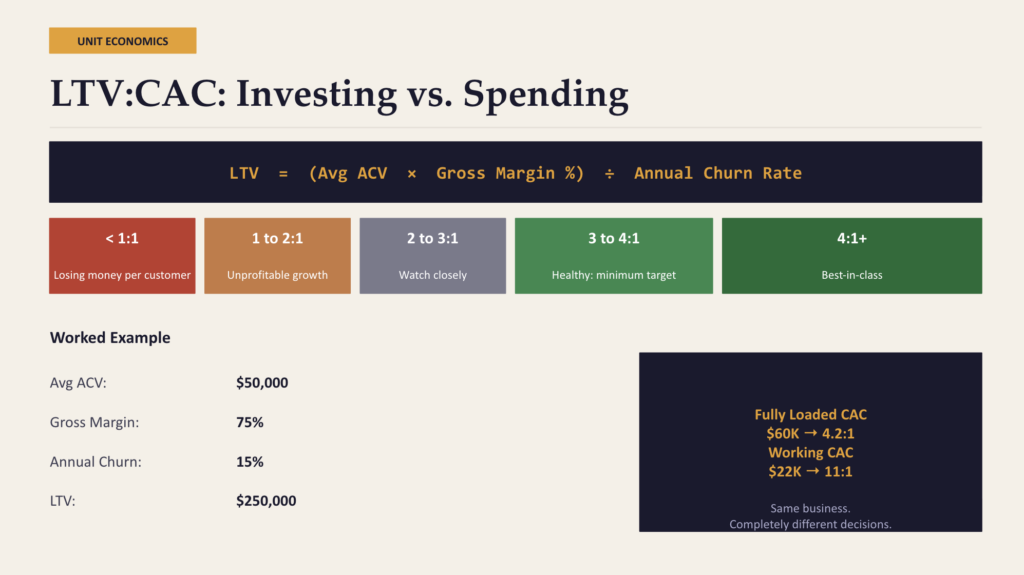
LTV = (Average Annual Contract Value x Gross Margin %) / Annual Customer Churn Rate
A portfolio company with a $50,000 average ACV, 75 percent gross margin, and 15 percent annual churn produces an LTV of approximately $250,000. If Fully Loaded CAC is $60,000, the LTV:CAC ratio is 4.2:1. If the marketing team is presenting Working CAC at $22,000, the same ratio appears to be 11:1. These two numbers produce completely different answers to the question of how aggressively to invest in customer acquisition.
LTV:CAC below 3:1 is a diagnostic signal. It means the business is not generating sufficient return on its acquisition investment and needs to move at least one of four levers: lower acquisition cost, higher pricing, improved gross margin, or better retention. LTV:CAC consistently above 5:1 with available capital often signals underinvestment in growth, not efficiency.
CAC Payback Period: The Cash Flow Question
The CAC payback period answers a different question from the LTV:CAC ratio. It answers how long the business is cash-flow negative on each new customer before the acquisition cost is recovered through gross-margin-adjusted revenue.
The formula:
CAC Payback Period (months) = Fully Loaded CAC / (Monthly Revenue per Customer x Gross Margin %)
A customer paying $4,200 per month on a product with 70 percent gross margin generates $2,940 in gross-margin revenue monthly. If Fully Loaded CAC is $48,000, the payback period is approximately 16 months. That 16-month figure represents how long the company is carrying an unrecovered investment on that account.
Industry benchmarks from Benchmarkit’s 2024 SaaS Performance Metrics Report: B2B SaaS median payback of 18 months, enterprise ACV above $100,000 at 24 months median, best-in-class across segments under 12 months. A company running at a 24-month payback while growing 30 percent annually requires materially more working capital than a peer growing at the same rate with a 12-month payback. The LTV:CAC ratio will not reveal this. The payback period will.
The LTV:CAC ratio tells you whether the economics are sound. The payback period tells you how much cash the company needs to grow. A PE-backed board needs both.
Contribution Margin per Customer: The P&L View
The contribution margin calculation brings CAC directly into the income statement. For each customer cohort:
Contribution Margin per Customer = LTV minus Fully Loaded CAC minus Cost to Serve
Cost to serve includes customer success, support, and ongoing account management that do not belong in CAC but do reduce the net financial contribution of each customer relationship over its lifetime.
A business with a healthy LTV:CAC ratio can still generate thin contribution margins if cost to serve is elevated, a pattern common in businesses where customer success teams carry heavy service burdens on each account.
This calculation is particularly relevant when a PE operating partner is reviewing margin expansion potential ahead of a financing event or exit. If Fully Loaded CAC is $80,000, LTV is $300,000, and the cost to serve over the customer lifetime is $90,000, the net contribution is $130,000 per customer. That figure, not the LTV:CAC ratio, is the one that connects to EBITDA and therefore to valuation.
What a Corrected CAC Calculation Typically Reveals
When a PE-backed portfolio company moves from Working CAC to Fully Loaded CAC, several patterns appear consistently across the diagnostic process.
- The LTV:CAC ratio compresses significantly. A ratio that appears at 7:1 or 9:1 on Working CAC typically settles between 3:1 and 4.5:1 once full personnel and overhead costs are correctly allocated. This is not a problem in itself. It is a more accurate picture of the business. The decisions that depend on it, namely how aggressively to invest in acquisition and how much capital that investment requires, should be made with an accurate number.
- Channel economics diverge sharply. The highest-volume acquisition channels are frequently not the lowest-cost channels on a fully loaded basis. Organic search and content-driven acquisition typically show the most favorable fully loaded CAC economics. Paid search and outbound field sales typically show the highest. The capital allocation implication changes depending on which channel you plan to scale.
- The payback period is longer than projected. Portfolio companies operating under a 12-month payback assumption regularly find that the actual period is 18 to 22 months when fully loaded costs and timing lags are applied correctly. This changes the cash flow projection, the funding requirement between now and profitability, and the expected timeline to free cash flow generation.
- Blended metrics have been masking segment-level problems. An average CAC that looks defensible at $200 can contain a $90 CAC on a high-volume SMB motion and a $650 CAC on an enterprise expansion that the business has been scaling aggressively. These findings do not appear in blended reporting.
The corrected calculation does not change the business. It changes the quality of the decisions made about it. Accurate unit economics are the input to every material capital allocation question a CFO and board will face in the next 12 months: how much to invest in growth, where to invest it, what the runway looks like at different growth rates, and what the business is worth.
The Finance and Marketing Alignment Problem
The CAC reporting gap is not an isolated data problem. It reflects a structural disconnect between how finance and marketing define success. According to McKinsey research published in 2025, CEO-CMO misalignment increased 20 percent between 2023 and 2025, driven in part by marketing’s disconnect from company growth metrics. The same dynamic operates between CFOs and marketing teams at the portfolio company level.
In McKinsey’s reporting, 70 percent of CEOs measure marketing’s impact through year-over-year revenue growth and margin contribution. Only 35 percent of CMOs track those as their primary metrics. The Deloitte 2023 CFO Signals study found that companies with tight CMO-CFO alignment grew EBITDA 12 percent faster than those without it. The gap between what finance needs and what marketing reports is not a communication preference. It is a growth variable.
The implication for a PE-backed CFO is practical. The fix is not a new attribution platform or a different dashboard. It is a decision to reconcile the two CAC definitions, agree on what Fully Loaded CAC means for this business, and build the calculation once from GL data. Once built, it becomes the standard input for board reporting on acquisition economics.

How Azarian Growth Agency Works With PE-Backed Companies on This
Azarian Growth Agency works with PE-backed portfolio companies to reconstruct fully loaded unit economics and identify where the gap between reported and actual CAC is creating downstream errors in planning and capital allocation.
The work starts with a Strategic Growth Diagnostic that produces a clear picture of acquisition cost by channel, a recalculated LTV:CAC and payback period using fully loaded inputs, and a ranked set of findings tied directly to EBITDA impact.
The diagnostic does not require new tooling or a new attribution system. It requires a structured review of the data the business already has in its GL, CRM, and HR systems, and a methodology for combining them into a single, board-ready acquisition cost calculation.
The findings from the diagnostic typically address three questions:
- Where is the business understating acquisition cost in a way that is inflating its apparent unit economics?
- Which channels have the most favorable fully loaded CAC economics and would generate the best return on incremental acquisition investment?
- What does the CAC payback period imply about the working capital requirement at the growth rate the board is currently planning toward?
If your current CAC figure comes from the marketing dashboard rather than the general ledger, there is a high probability that the unit economics your board is relying on are built on a partially loaded number. The fix is not complicated. It is a matter of including the costs that are already in your systems in a calculation that they have never been part of.
Talk with our growth experts to schedule a Strategic Growth Diagnostic.
Resources
| Source | Author / Publisher | Why It Matters |
| How To (Actually) Calculate CAC | Andrew Chen / Brian Balfour | Authoritative breakdown of fully loaded vs. working CAC with real examples |
| Benchmarkit 2024 SaaS Performance Metrics Report | Benchmarkit | CAC payback benchmarks by ACV and company stage; 18-month median B2B SaaS |
| LTV:CAC Ratio Formula and Benchmarks | Wall Street Prep | Financial definition of LTV:CAC with investor benchmark context |
| What Marketing Costs Should Be Included in CAC? | Kellblog / Dave Kellogg | Practitioner-level breakdown of cost allocation methodology for S&M |
| CAC Payback Period: Formula and Benchmarks | Drivetrain | Payback period formula, segment benchmarks, and reduction strategies |
| Essential SaaS Metrics for a Series A Fundraise | The SaaS CFO | Investor-grade definitions of LTV:CAC, payback, and efficiency metrics |
| Deloitte CFO Signals 2023 | Deloitte | Companies with tight CMO-CFO alignment grew EBITDA 12% faster |
| McKinsey: How CFOs and CMOs Can Drive Long-Term Growth | McKinsey & Company | CEO-CMO misalignment trends and the case for finance-led marketing accountability |